
Figures & data
Figure 1. Path planning for MRC-AM by directly segmenting a slice into sub-regions.
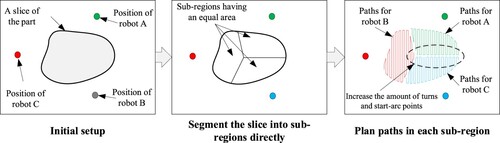
Figure 2. Overall workflow for allocating deposition paths for MRC-WAAM.
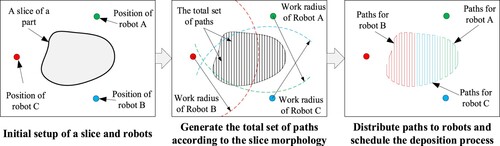
Figure 3. The computational mechanism for assigning paths to multiple robots.
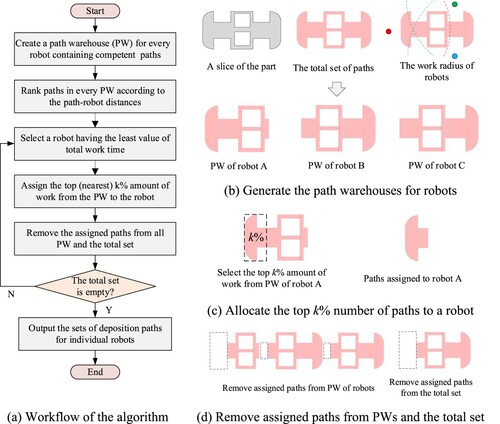
Figure 4. Generation of deposition tasks.
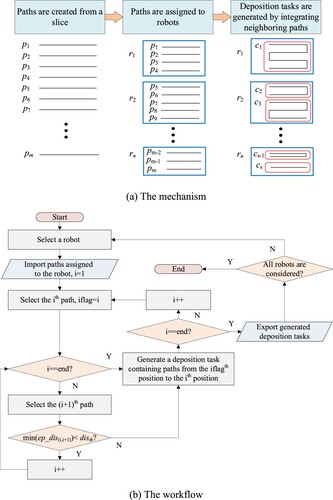
Figure 5. Defining the work periods (WPs) of a deposition plan.
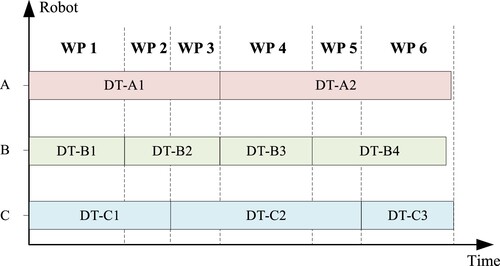
Figure 6. The mechanism for checking the swept area of robots within a WP.
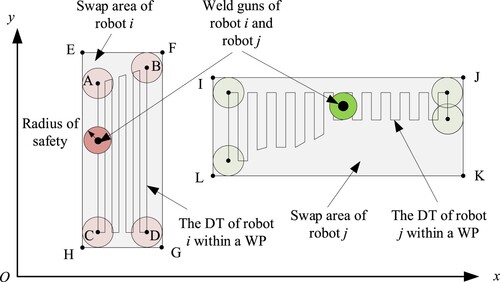
Figure 7. The workflow for scheduling a deposition plan for the MRC-WAAM system.
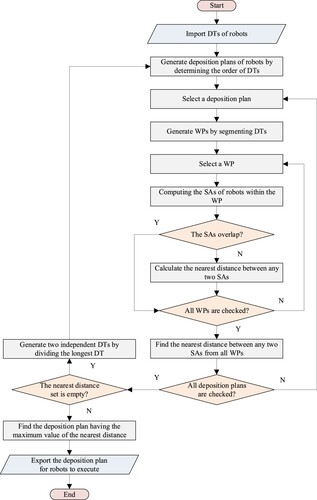
Figure 8. The implemented test platform.
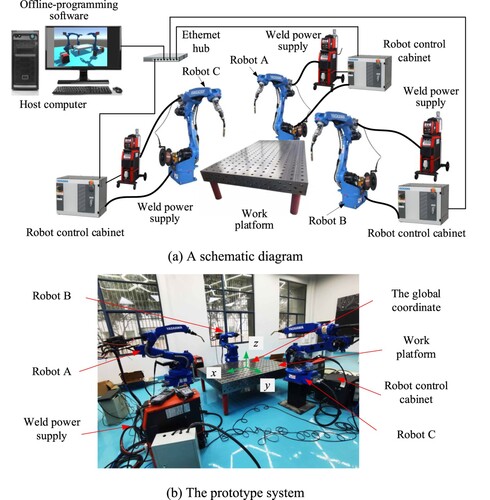
Figure 9. Spatial relationship among robots and the centre of part.
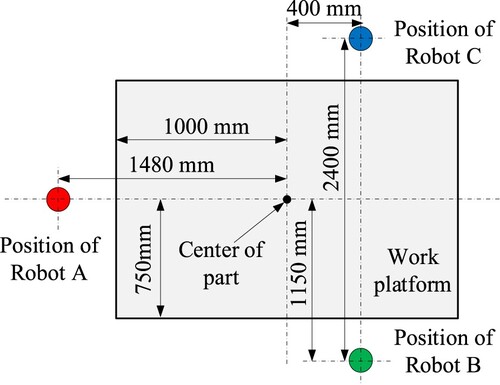
Table 1. Chemical composition of substrate and fed-wire (wt.%).
Table 2. Parameters applied for experimental validation.
Figure 10. The models used for validation.
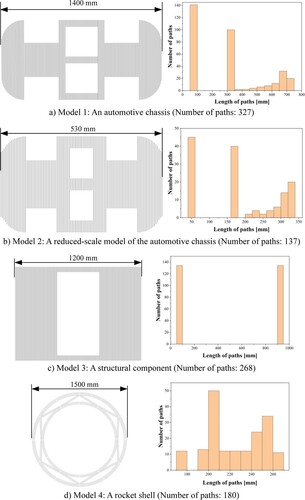
Figure 11. The influence of k on the algorithm performance.
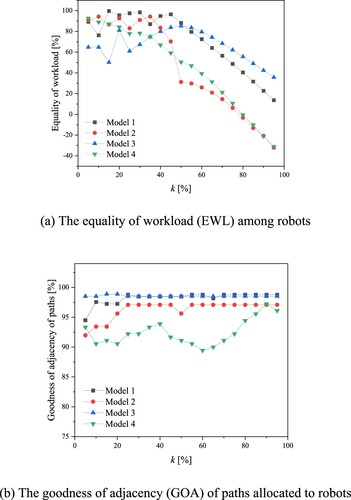
Figure 12. The path allocation results using the proposed top k% method.
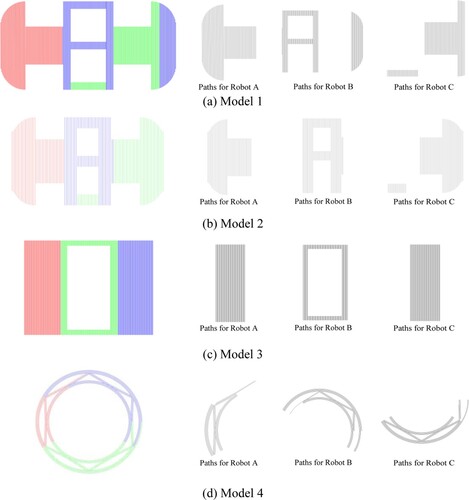
Figure 13. The results of assigning paths individually.
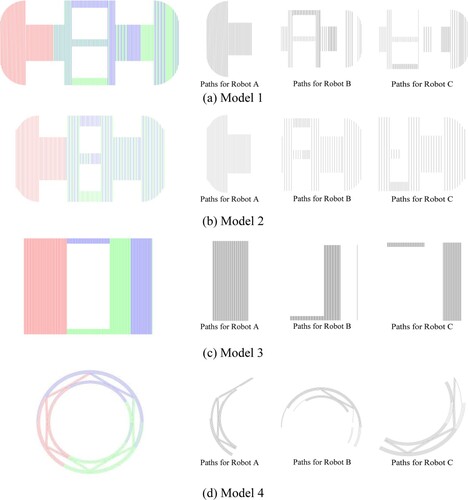
Table 3. Comparison between the two developed approaches.
Figure 14. The Gantt diagram of the deposition process.
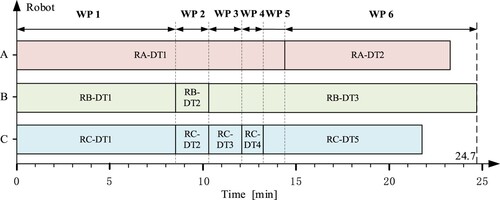
Figure 15. Results of deposition tasks generation and scheduling.
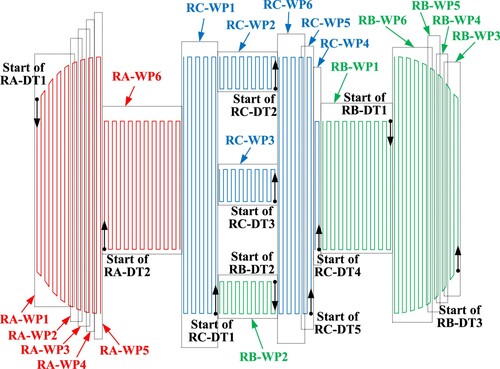
Figure 16. The distances among the swap areas over the work periods.
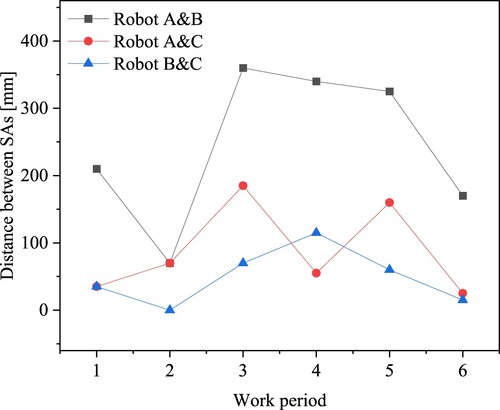
Figure 17. The appearance of the deposited slice.
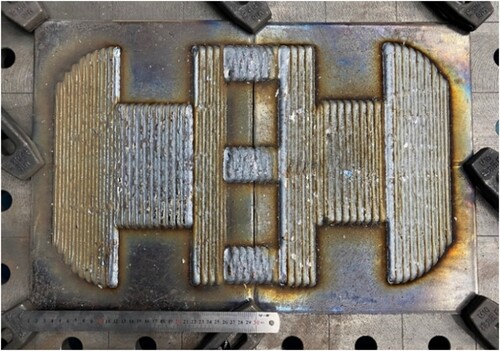
Figure 18. The deposition plan scheduled using the strategy proposed by Bhatt et al. [Citation31].
![Figure 18. The deposition plan scheduled using the strategy proposed by Bhatt et al. [Citation31].](/cms/asset/2ea54b7f-5b17-414a-b73b-922d1579dc5a/nvpp_a_2300680_f0018_oc.jpg)
Figure 19. The deposition plan scheduled using the strategy proposed by Shen et al. [Citation33].
![Figure 19. The deposition plan scheduled using the strategy proposed by Shen et al. [Citation33].](/cms/asset/78da1fee-d355-4d0a-ac1f-41f913e44a98/nvpp_a_2300680_f0019_oc.jpg)
Table 4. Comparison of the proposed method with the state-of-the-art.
Data availability statement
The data presented in this study are available on request from the corresponding author.