
Figures & data
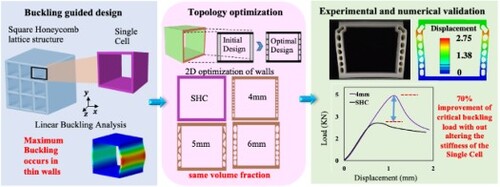
Figure 1. A TO-driven approach to design buckling-resistant LSs.
Figure 2. Design flow: (a) FE analysis of SC and mode shape for 20% relative density (b) TO on three initial designs of lattice face (c) Optimised designs and (d) Modified 2D CAD designs from smoothening TO designs.
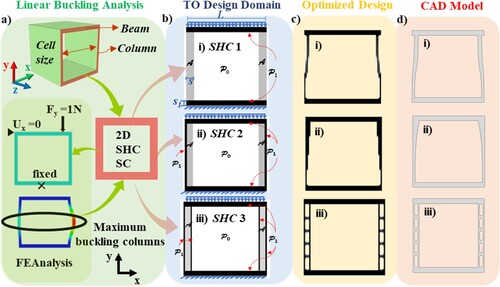
Figure 3. Evolution of (a) first BLF and (b) constraints for buckling maximisation TO of SHC1, SHC2 and SHC3 of 60 × 60 mesh.
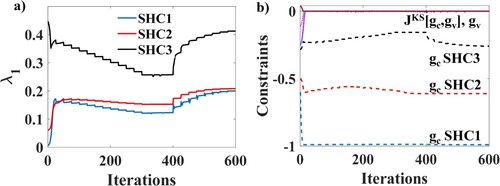
Figure 4. Numerical analysis with preliminary designs: (a) Linear Buckling modes, (b) Post buckling analysis.
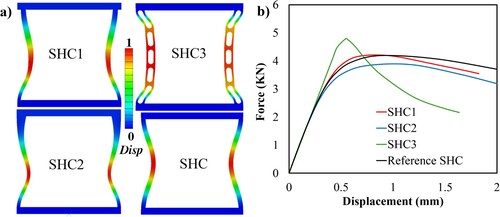
Figure 5. Parameterisation studies.
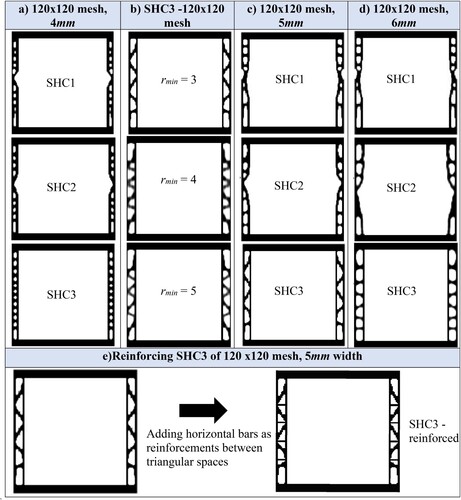
Figure 6. DFAM considerations (a) Smoothening of sharp step edges of TO design (b) Build orientation to prevent need for support structures (c) Minimum feature size and printing defects (d) Removing designs with very thin wall thickness (e) Weights of 3D printed designs.
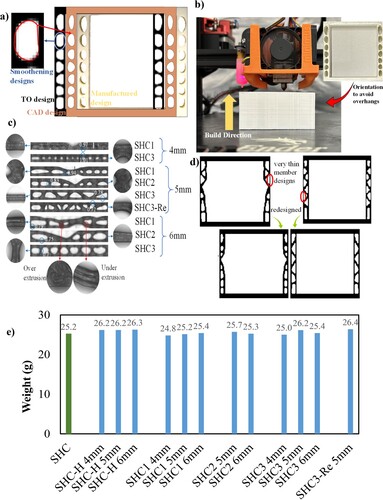
Figure 7. Few representative 3D printed specimens extruded from the 2D designs of 120 × 120 mesh SHC3 designs for different wall widths and Reference SHC with solid wall and hollow walls.
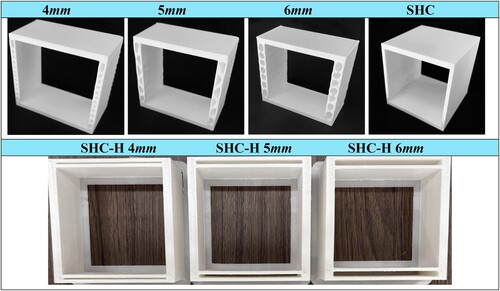
Figure 8. Experimental results. Force vs displacement curves for 120 × 120 mesh topologies of (a) 4 mm, (b) 5 mm, (c) 6 mm, (d) Comparison of best performing design SHC3 for various widths and reinforcement.
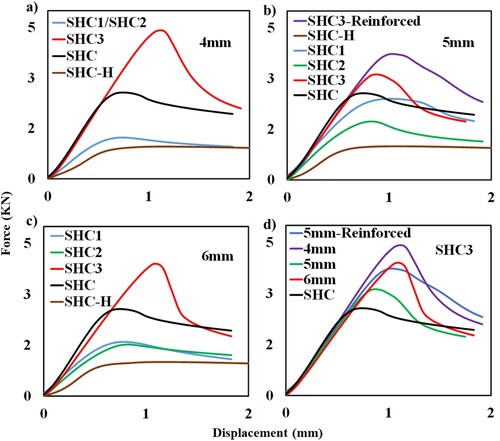
Figure 9. Comparison of experimental and numerical results for best performing SHC3 for (a) 4 mm, (b) 5 mm (c) 5 mm Reinforced and (d) 6 mm along with the first mode shapes from linear buckling analysis.
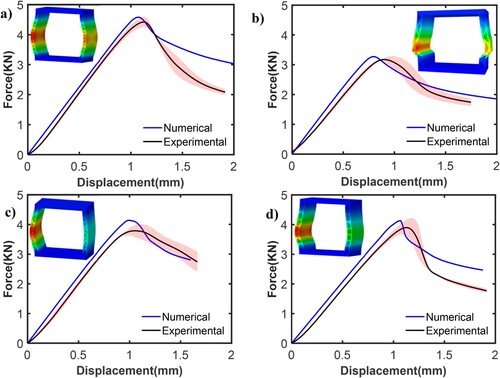
Figure 10. Comparison of experimental and numerical results for best performing SHC3 for (a) 4 mm, (b) 5 mm (c) 5 mm Reinforced and (d) 6 mm for postbuckling strain of 2%.
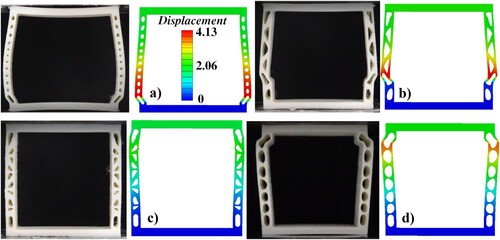
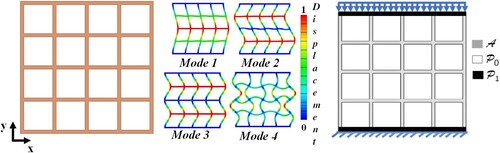
Figure 11. Potential future extensions: Scaling the present methodology to a 4 × 4 cell lattice structure. (a) CAD design of the lattice to be optimised (b) first four linear buckling modes and (c) active–passive-void design domains for TO.
Supplemental Material
Download MS Word (6 MB)Data availability statement
The data that support the findings of this study are available from the corresponding author upon reasonable request.