
Figures & data
Figure 1. Schematic diagram of enhanced bone regeneration GelMA/Bentonite.
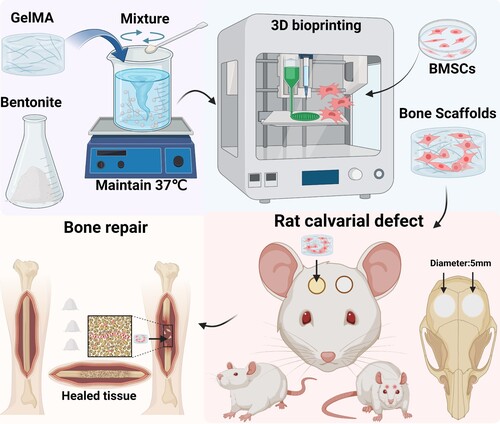
Figure 2. Synthesis and composition of GelMA/bentonite bioinks. (A) FTIR spectra of bioinks. (B) XRD spectra of bioinks. (C) and (D) TGA comparison across diverse concentrations of GelMA/Bentonite composites. (E) Contact angle of bioinks. (F) XPS of bioinks. (G) Ca, P, and Mg ions Concentrations of SBF immersed with GelMA, 1.25% GelMA/Bentonite, 2.5% GelMA/Bentonite, and 5% GelMA/Bentonite scaffolds for 10 days.
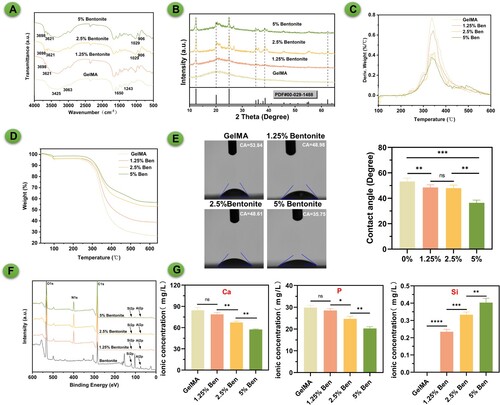
Figure 3. Rheological and mechanical properties of GelMA/bentonite bioinks. (A) Storage modulus (G’) and loss modulus (G”). (B) Temperature effects on storage modulus (G’) and loss modulus (G”). (C) Compressive stress-strain curve. (D) Young's modulus.
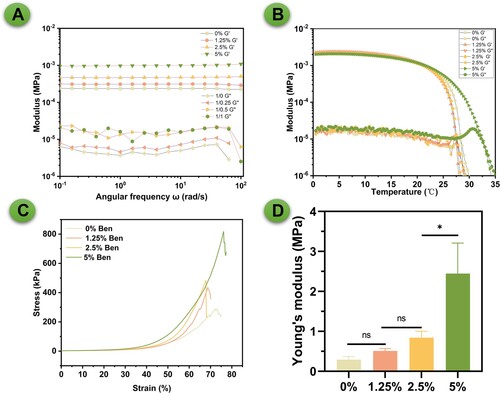
Figure 4. Evaluation of extrusion-based 3D printing performance for composite bioinks. (A) Presents digital images of 3D printed scaffolds from different bioink formulations: pure GelMA, and GelMA enhanced with 1.25%, 2.5%, and 5% Bentonite. (B) Diffusion rate for each bioink composition. (C) Printability assessment.
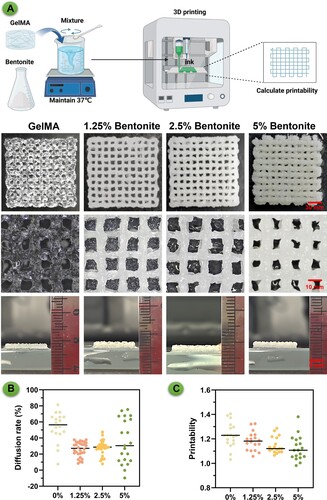
Figure 5. Microstructure and composition of 3D printed bioink scaffolds. (A) SEM images of 3D printed scaffolds from different bioink formulations: pure GelMA, and GelMA enhanced with 1.25%, 2.5%, and 5% Bentonite. (B) EDS spectra of GelMA/Bentonite scaffolds.
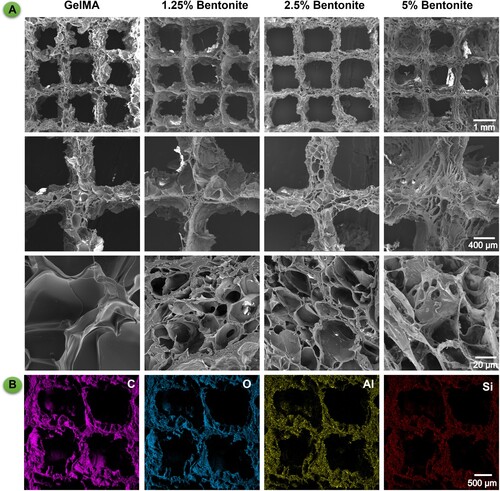
Figure 6. Biocompatibility properties of printed scaffolds. (A) Schematic diagram of GelMA/Bentonite 3D bioprinting. (B) The live/dead staining of MSCs cultured on scaffolds demonstrates the biocompatibility of GelMA with varying Bentonite concentrations. (C) OD value from the CCK-8 assay over 7 days indicate cell proliferation rates. (D) Gene expression of ColA1, Runx2, and OPN after 7 days.
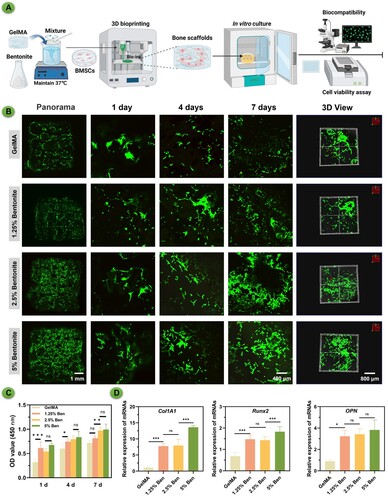
Figure 7. In vivo mineralisation of bioprinted scaffolds subcutaneous culture in nude mice over time. (A) Schematic diagram of GelMA/Bentonite mineralisation research. (B) μCT reconstructions demonstrating the progressive mineralisation of bioprinted scaffolds after 2 and 4 weeks of in vivo cultivation. (C) Mineral density. (D) Total mineral volume. (E) Trabecular separation. (F) Trabecular number.
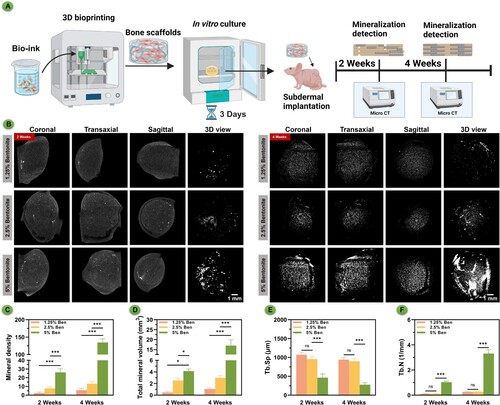
Figure 8. Immunohistochemistry of bioprinted scaffolds after subcutaneous culture in nude mice for 4 weeks. (A) Schematic diagram of GelMA/Bentonite for angiogenesis and osteogenesis promotion. (B) HE, Masson's trichrome, ALP, and ARS staining of GelMA/Bentonite scaffolds implanted subcutaneously in nude mice at 4 weeks.
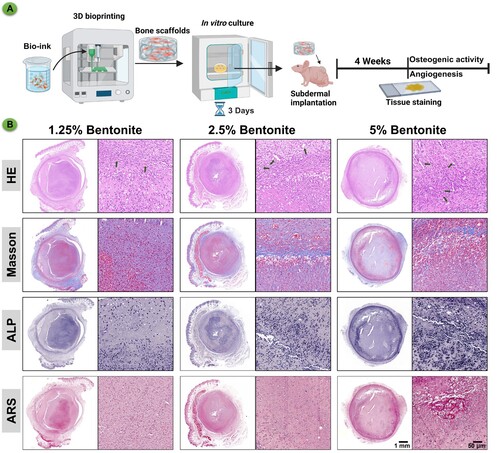
Figure 9. Bone regeneration evaluation at 4 and 8 weeks of 3D printed scaffolds by a rat calvarial defect mode in vivo. (A) Schematic diagram of GelMA/Bentonite scaffolds treatment for rat cranial defects. (B) Reconstructed micro-CT scans of the defects in SD rats. (C) Histological staining including HE and Masson's Trichrome staining of calvaria sections. (D) BMD (bone mineral density). (E) BV/TV (bone tissue volume/total tissue volume). (F) Tb. N (Trabecular number). (*P < 0.05, **P < 0.01 and ***P < 0.001).
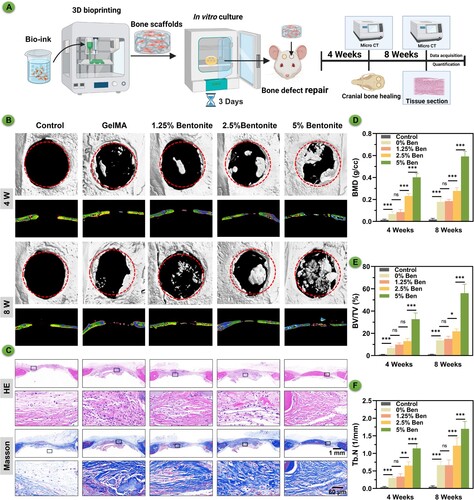
Figure 10. Immunofluorescence staining of scaffolds at 8 weeks after scaffolds by a rat calvarial defect mode in vivo. (A) OPN, OCN and CD31/α-SMA staining. (B-E) Quantification of immunofluorescence staining.
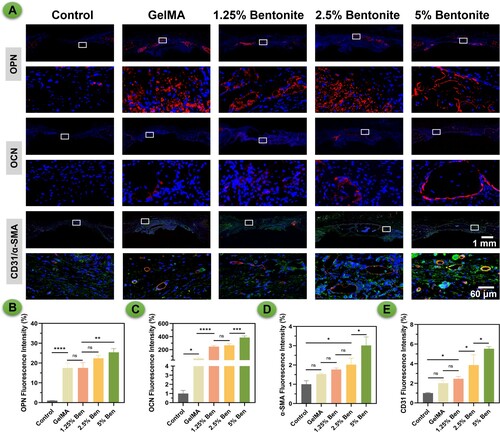
Figure 11. The degradation of scaffolds. (A) Images of in vivo imaging displaying the degradation of bioprinted scaffolds labelled by Sulfo-Cy5.5 NHS ester. (B) Degradation rate in vitro. (C) Swelling ratio in vitro.
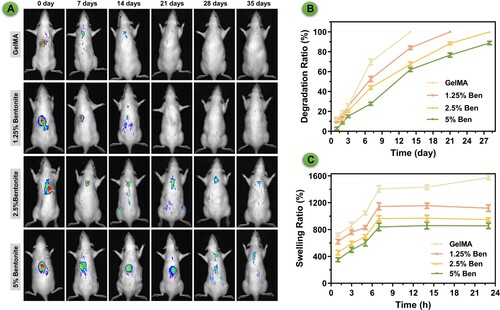
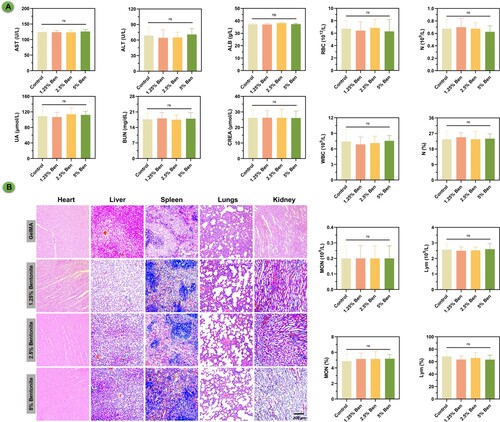
Figure 12. Assessment of cytotoxicity of bioprinted scaffolds. (A) Blood biochemical indicators. (B) HE staining results of various organs in rats after implantation of scaffolds for 4 weeks.
Supplemental Material
Download PDF (230.9 KB)Data availability statement
The data that support the findings of this study are available from the corresponding author, J. Su, upon reasonable request.