
Figures & data
Figure 1. An overview of the rectilinear infill designs (60 mm × 10 mm × 10 mm): top view of the infill structure, infill spacing, infill angles, and their corresponding extrusion length.
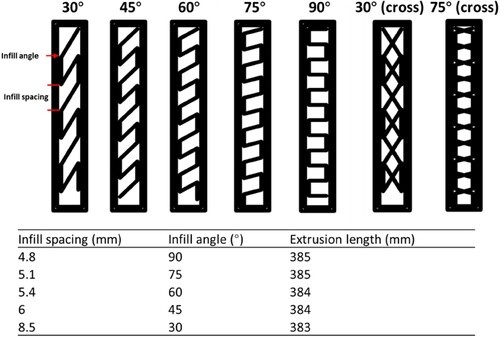
Figure 2. A: simulated stress over flexure strain of the designs varied in infill angles. B: relative flexure modulus calculated based on A. C: measured flexure stress over flexure strain (0 to 0.07) based on three-point bending tests (n = 2). D: flexure modulus (Pa) calculated based on the stress-strain curves shown in C, the error bar represents standard deviation from duplicated measurements. Significant differences (P < 0.05) are indicated by the lowercase letters.
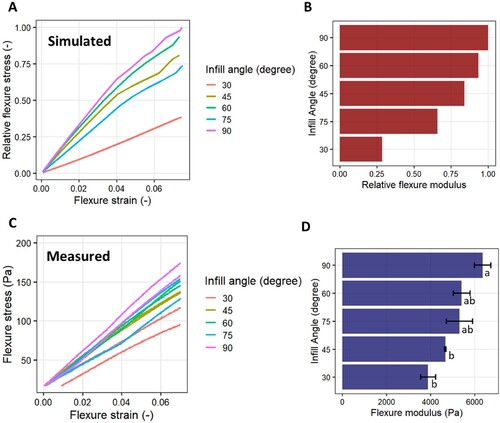
Figure 3. Measured flexure stress over flexure strain of the designs varied in infill angles obtained from three-point bending tests (n = 2).
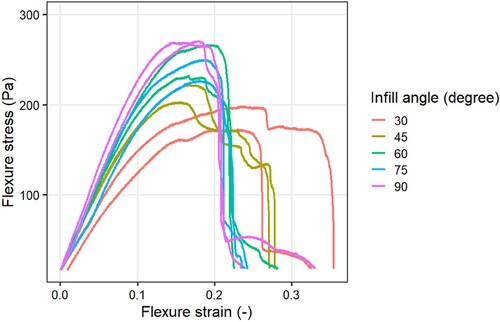
Figure 4. A: texture map (fracture strain vs fracture stress) of 3D-printed samples varied in infill angles. B: DIC strain map of a 3D-printed sample with 30° infill angle at fracture point. C: DIC strain map of a 3D-printed sample with 90° infill angle at fracture point. D: texture map (failure strain vs fracture stress) of 3D-printed samples varied in infill angles. E: DIC strain map of a 3D-printed sample with 30° infill angle at failure point. F: DIC strain map of a 3D-printed sample with 90° infill angle at failure point. The heatmap represents the strain changes with respect to the undeformed image of each sample.
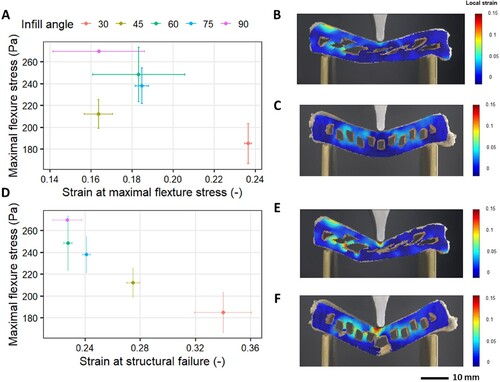
Figure 5. A: simulated stress over flexure distance of the designs varied in infill angle orientations (Bi: binary alternation, Tri: ternary alternation). B: relative flexure modulus calculated based on A. C: measured flexure stress over flexure strain (0 to 0.07) based on three-point bending tests. D: flexure modulus (Pa) calculated based on B. The error bar represents the standard deviation from duplicate measurements. No significant differences (P > 0.05) are found.
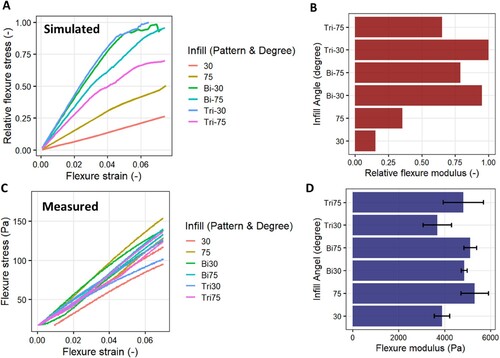
Figure 6. Measured flexure stress over flexure strain of the designs varied in infill angle orientations obtained from three-point bending tests (n = 2).
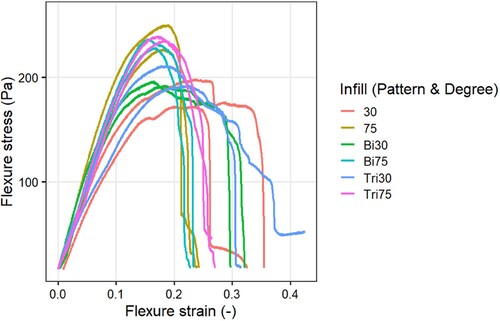
Figure 7. A: texture map (fracture strain vs fracture stress) of 3D-printed samples varied in infill angle orientations (Bi: binary alternation, Tri: ternary alternation). B: texture map (failure strain vs fracture stress) of 3D-printed samples varied in infill angle orientations. C: DIC strain maps of 3D-printed samples varied in infill angle orientations at failure point. The right circles indicate the failure positions on each sample.
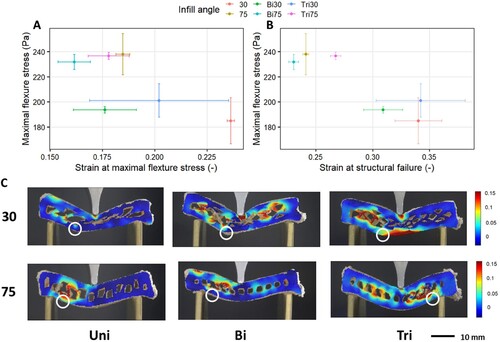
Figure 8. Frontal (top) and transversal (bottom) X-ray scans of no-alternation at 30° infill angle (A), binary alternation at 30° infill angle (B), ternary alternation at 30° infill angle (C), no-alternation at 75° infill angle (D), binary alternation at 75° infill angle (E), ternary alternation at 75° infill angle (F). The red arrows indicate the cavities and improper overhangs.
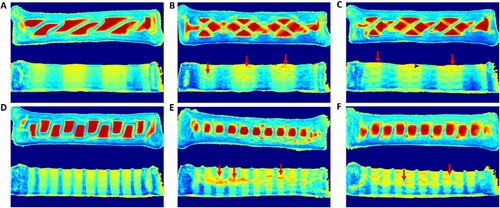
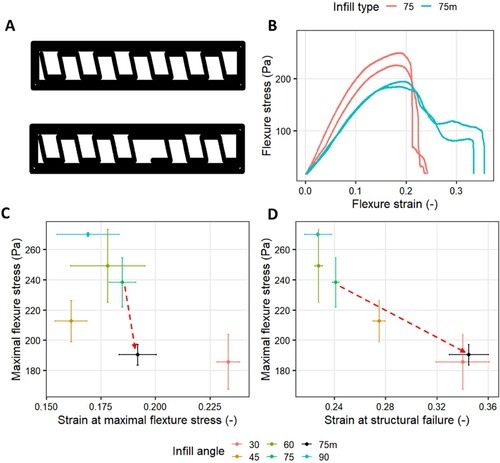
Figure 9. A: original (top) and modified (bottom) 75° infill design. B: measured flexure stress over flexure strain of original (75) and modified (75 m) infill structures. C: texture map (fracture strain vs fracture stress) of original (75) and modified (75 m) infill structures. D: texture map (failure strain vs fracture stress) of original (75) and modified (75 m) infill structures.
Data availability statement
The data obtained from this study are available from the corresponding author, LZ, upon reasonable request.