
Figures & data
Figure 1. Illustration of the semi-analytical thermal approach.
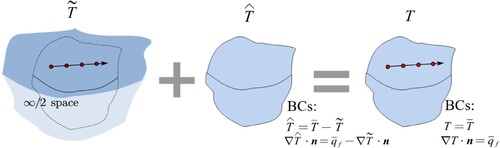
Figure 2. (a) The geometry of the simulated structure [Citation42]. (b) Half of the geometry modelled by taking advantage of the symmetry of the problem.
![Figure 2. (a) The geometry of the simulated structure [Citation42]. (b) Half of the geometry modelled by taking advantage of the symmetry of the problem.](/cms/asset/e80c20e4-4005-4487-8a16-d9df0114b0f2/nvpp_a_2349683_f0002_oc.jpg)
Figure 3. (a, b) The analytical temperature distribution along x2 axis. In (a), various acceleration factor κ with the original diffusion time tr = 0.01 s are employed, and in (b), the acceleration factor κ is set as 200 with various diffusion time tr. (c) The real temperature T along path 1 (see (a)).
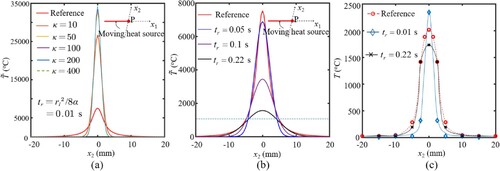
Figure 4. The temperature as a function of time for point (a) G1 and (b) G2 (see (a)). For the simulated results, only the cooling period is displayed, and the correspondingly starting moment of the simulated cooling period is shifted to match that of the experiment.
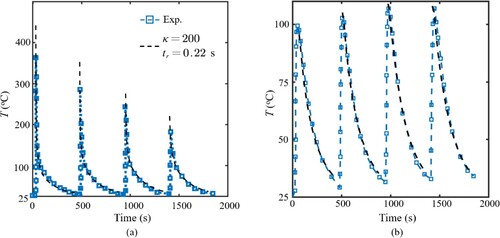
Figure 5. The von Mises stress along path 2 (a) before and (b) after removal from the backing plate.
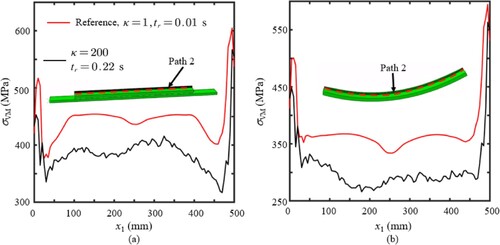
Figure 6. The displacement component U3 after building the fourth layer and removing the clamps.
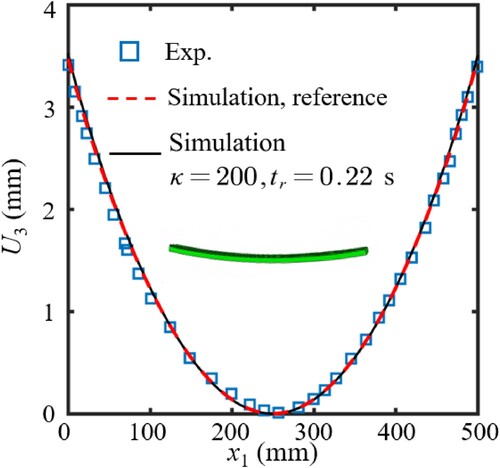
Figure 7. (a) Geometry of the WAAM component. (b) Experiment setup of the WAAM process.
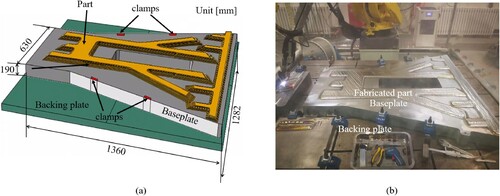
Figure 8. Moving path of the heat source for a certain layer.
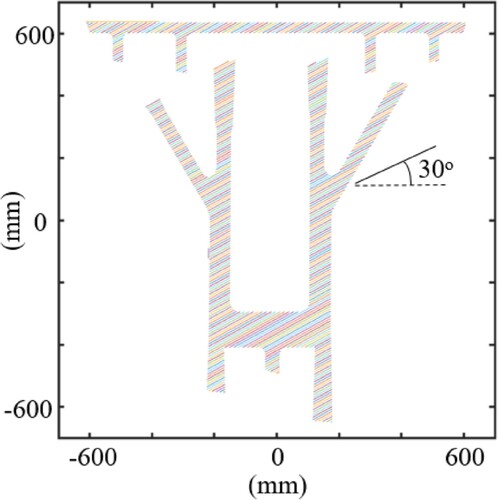
Figure 9. The deformation after the part is fabricated. A scale factor of 5 is applied.
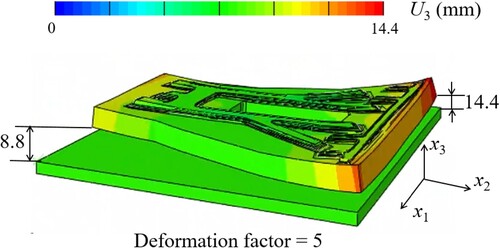
Figure 10. The von Mises stresses of the component (a) before and after (b) the annealing process. The clamps are removed for both situations.
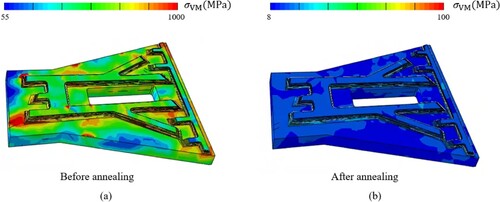
Figure 11. The displacement component U3 along path 3 before and after the annealing. The clamps are removed for both situations.
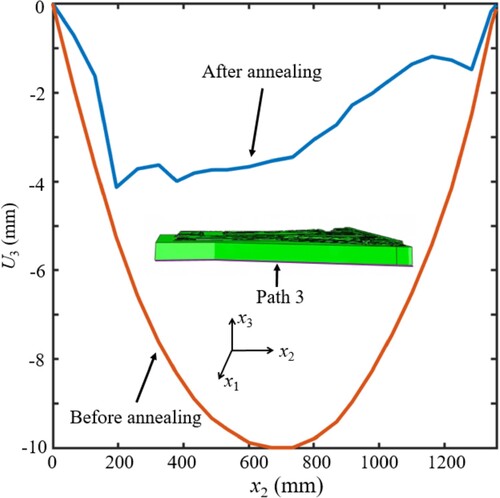
Table C1. Thermal properties of mild steel S355 employed in the simulation [Citation27].
Table C2. Mechanical properties of mild steel S355 employed in the simulation.
Table C3. Thermal properties of TC11 employed in the simulation.
Table C4. Mechanical properties of TC11 employed in the simulation.
Table C5. Creep behaviour of TC11 [Citation36].
Table C6. Creep parameter employed in the simulation (in MPa-mm unit).
Data availability
The raw/processed data required to reproduce these findings is available from the corresponding authors on reasonable request.