
Figures & data
Figure 1. Schematic diagram of the intelligent metal AM system.
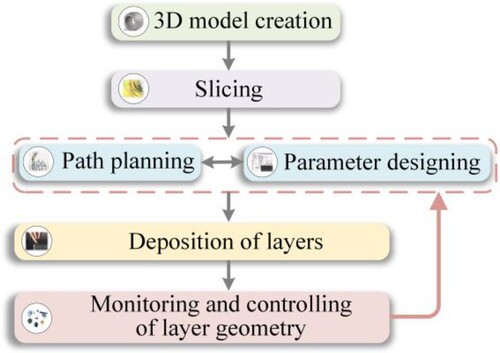
Table 1. Summary of research on data modelling between process parameters and layer geometries in metal AM.
Figure 2. Schematic diagram of the wire-laser DED system.
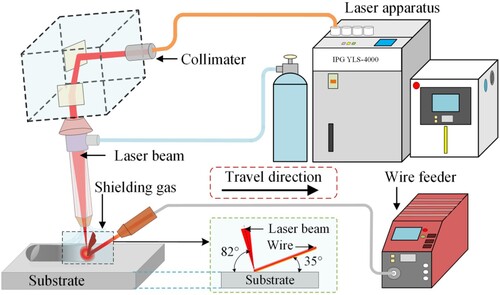
Table 2. The values of process parameters at different levels.
Figure 3. Schematic diagram of the deposited layer geometry.
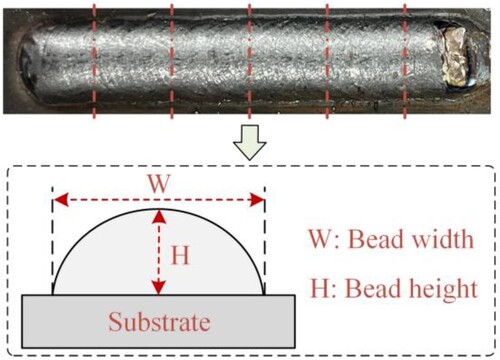
Table 3. Parameter design and results of the training experiments.
Table 4. Parameter design and measured layer geometries of the testing experiments.
Figure 4. Schematic diagram of the SVR model displaying the maximising ϵ-interval among the samples furthest from the hyperplane f(x).
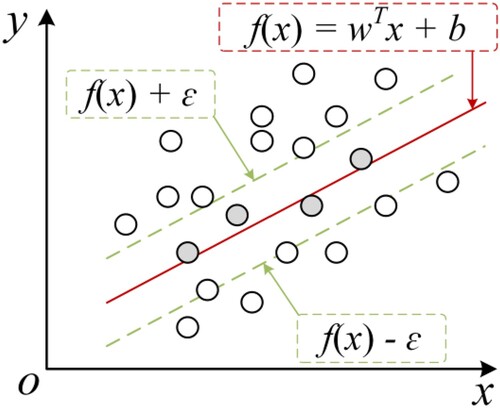
Table 5. Parameters of various ML models for layer geometry regressions.
Figure 5. Schematic of non-dominated sorting and crowded distance. (a) Non-dominated sorting. (b) Crowded distance.
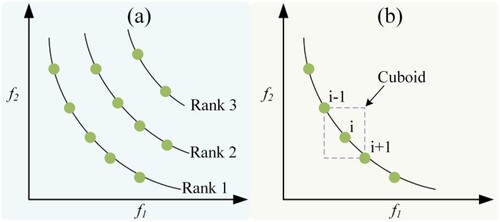
Figure 6. Flowchart of the process parameter optimisation for desired layer geometries.
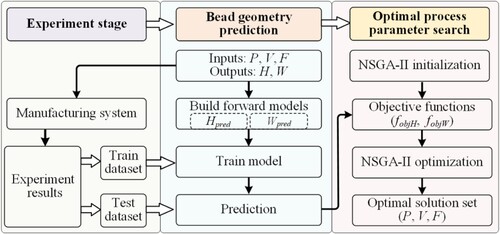
Figure 7. Accuracy and MAE results of various ML models for layer height prediction on training and testing datasets.
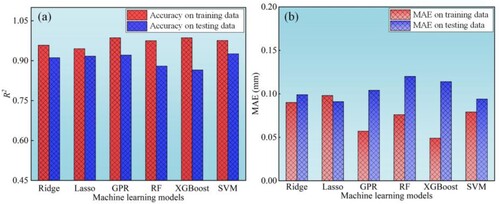
Figure 8. Accuracy and MAE results of various ML models for layer width prediction on training and testing datasets.
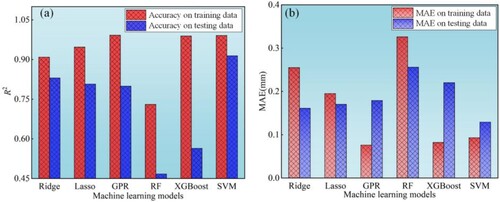
Figure 9. Predicted results of the Hpred and Wpred models based on the training data. (a) Hpred model. (b) Wpred model.
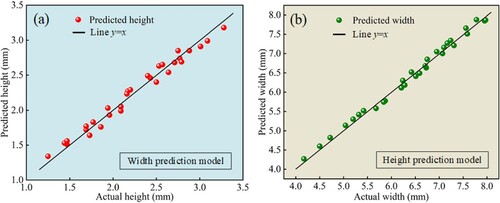
Figure 10. The APE values of the Hpred and Wpred models based on the training data.
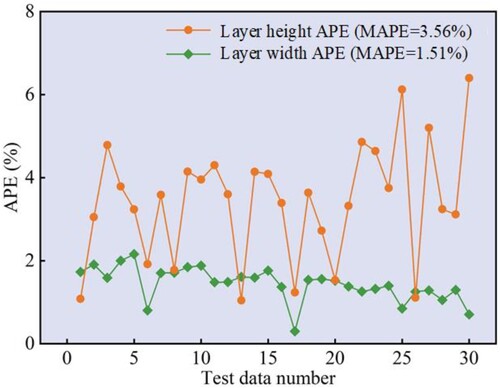
Figure 11. Scatter diagrams of actual and predicted layer geometries and prediction accuracy distribution based on the testing data. (a) Layer height. (b) Layer width.
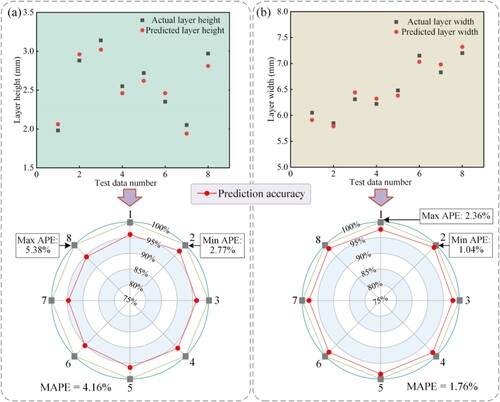
Figure 12. Pareto front plots of multiple objective functions under different training experiments selected in Table 3. (a) No. 10. (b) No. 15. (c) No. 20. (d) No. 25.
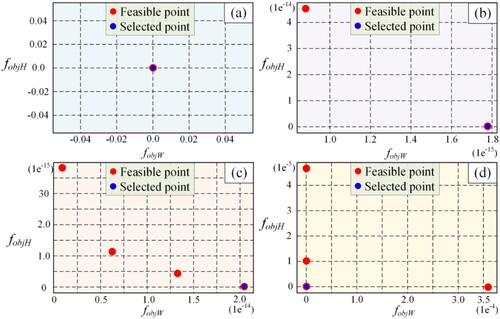
Table 6. Analysis of actual and predicted layer geometries.
Figure 13. Cross-sections of single layers deposited by the predicted process parameters in Table 7. (a) No. 1. (b) No. 2. (c) No. 3. (d) No. 4. (e) No. 5. (f) No. 6. (g) No. 7. (h) No. 8.
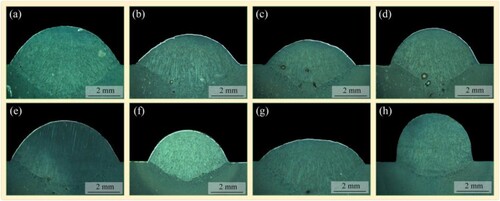
Figure 14. Scatter diagrams of desired and actual layer geometries and corresponding error distribution maps. (a) Layer height. (b) Layer width.
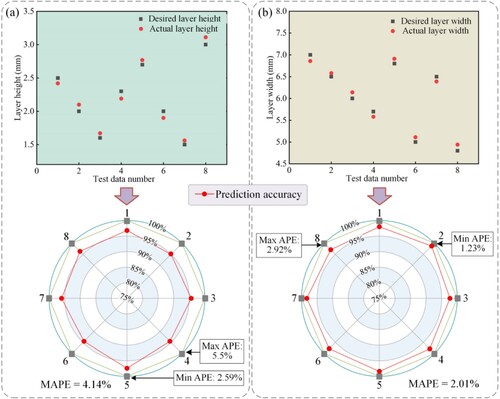
Table 7. Desired layer geometries and predicted process parameters.
Figure 15. Flowchart of the collaborative optimisation framework of forming quality, microstructure, and mechanical property in laser-DED.
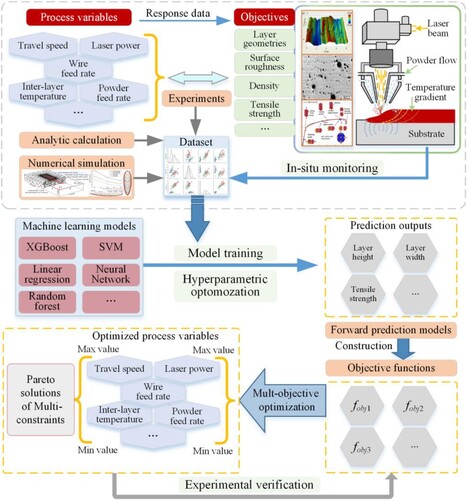
Table 8. Controllable parameters and optimisation objectives in metal laser-DED.
Data availability statement
Data available on request from the authors.