
Figures & data
Figure 1. (a) Wire-based electron beam directed energy deposition machine; (b) the schematic diagram of electron beam directed energy deposition process; (c) the morphology of the as-built wall-structured NiTi alloy part.
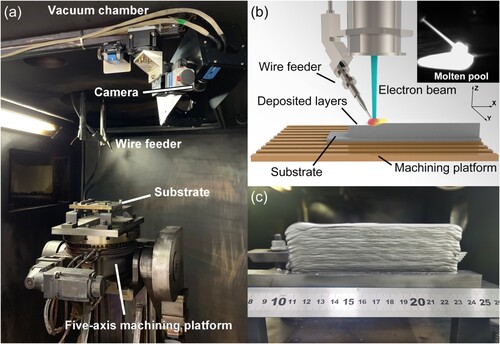
Figure 2. Optical micrograph images of as-built NiTi alloys observed on the Y-Z cross section (along the building direction).
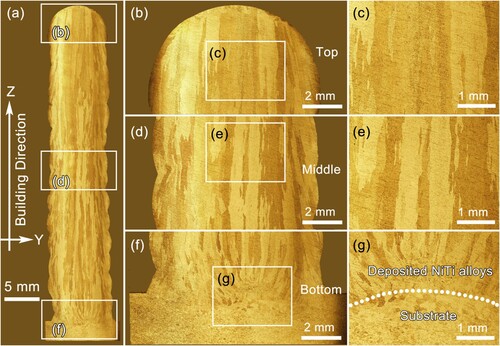
Figure 3. (a) Schematic diagram of artificial thermal cycling treatment conducted between 90°C water and liquid nitrogen; (b) TEM image of as-built NiTi alloys; SAED patters of (c) B2 matrix and (d) TiC phase; (e) TEM image of high-density dislocations in NiTi alloys after 50 times thermal cycling treatment.
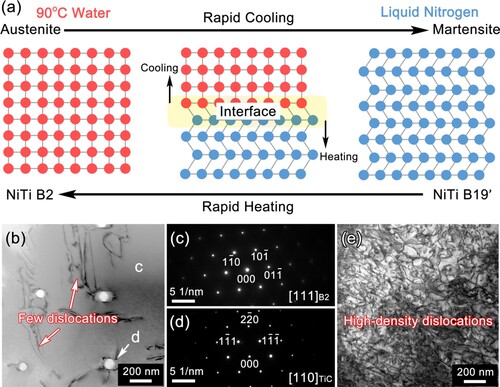
Figure 4. Phase transformation behaviour of NiTi alloys at as-built (AB) state and after 50 thermal cycles (50TC).
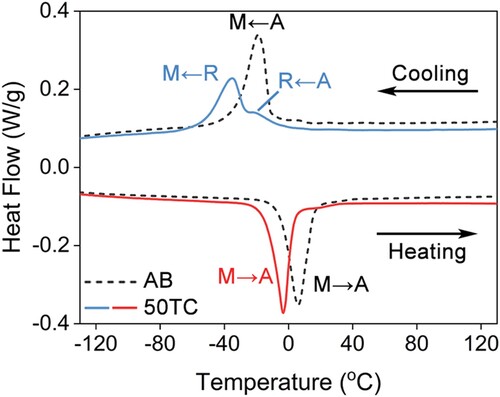
Figure 5. Phase transformation behaviour of 50 times thermal cycling treated (50TC) samples aged at 250°C for (a) 1 h, (b) 4 h, (c) 8 h, (d) 12 h, (e) 24 h, (f) 48 h, (g) 100 h, (h) 200 h, respectively. The corresponding results for the aged samples without prior thermal cycles treatment are provided for comparison, as depicted by dashed lines.
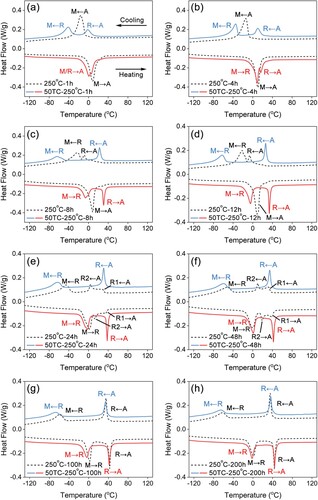
Figure 6. Ten times cyclic tensile curves of as-built (AB) and 50 times thermal cycling treated (50TC) samples to a constant strain of 6%.
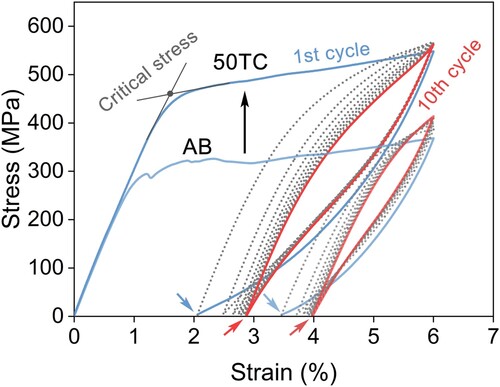
Figure 7. Ten times cyclic tensile curves to a constant strain of 6% of 50 times thermal cycling treated (50TC) samples aged at 250°C for (a) 1 h, (b) 4 h, (c) 8 h, (d) 12 h, (e) 24 h, (f) 48 h, (g) 100 h, (h) 200 h, respectively. The corresponding aged samples without thermal cycle are provided for comparison, as plotted by gray lines and shown in (a*–h*), respectively.
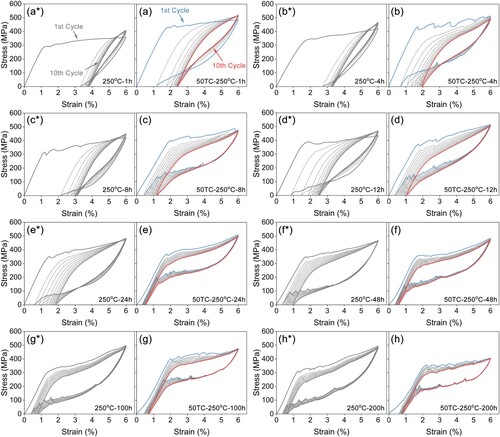
Figure 8. (a, b) The accumulated residual strain after per cycle and (c, d) the incremental residual strain in per cycle during the cyclic tensile test for all 250°C aged samples (a, c) with prior 50 thermal cycles and (b, d) without thermal cycle.
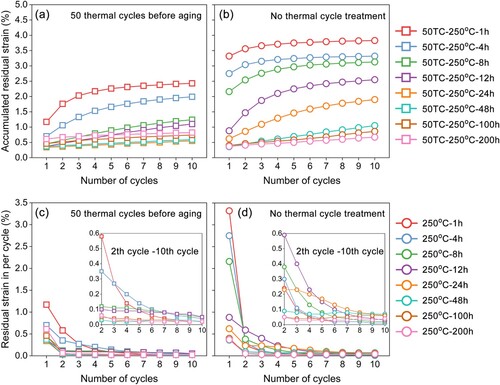
Figure 9. TEM images of 50 times thermal cycling treated sample after aging at 250°C for 24h: (a) R-phase; (b) grain boundary; (c) dislocations; (d) TiC phase; (e) SAED pattern including coexisting diffraction spots of B2 matrix, R phase and Ni4Ti3 phase; (f) high-resolution TEM image.
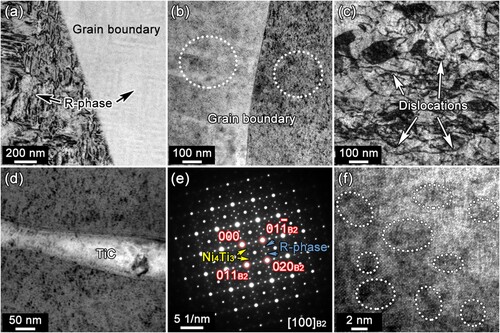
Figure 10. SEM images of samples (a, b, e, f, i, j, m, n) without thermal cycles and (c, d, g, h, k, l, o, p) with 50 thermal cycles (50TC) aged at 450°C for (a–d) 1 h, (e–h) 4 h, (i–l) 8 h, (m–p) 24 h, respectively.
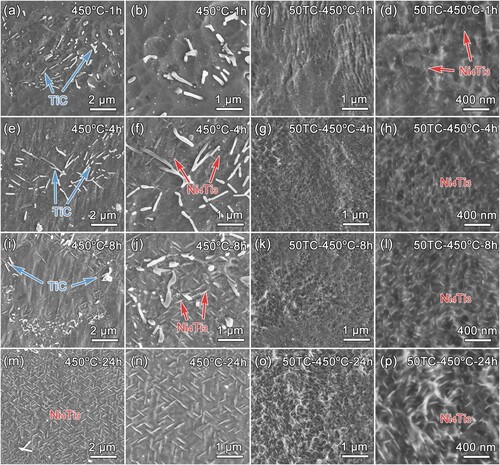
Figure 11. Phase transformation behaviour of 50 times thermal cycling treated (50TC) samples aged at 450°C for (a) 1 h, (b) 4 h, (c) 8 h, (d) 24 h, respectively. The corresponding aged samples without thermal cycle are provided for comparison, as depicted by dashed lines.
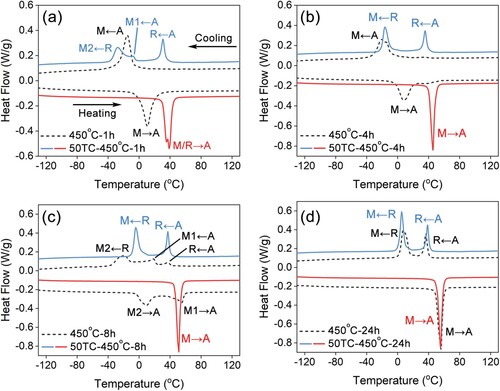
Figure 12. Ten times cyclic tensile curves of (a) EB-DED processed NiTi alloys without thermal cycling treatment, (b) conventional NiTi alloy plate, (c) EB-DED processed NiTi alloys with 50 times thermal cycling treatment, after aging at 250°C for 24 h. The conventional NiTi alloy plate are fully annealed with with an average grain size of 12 μm.
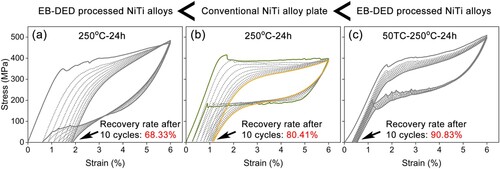
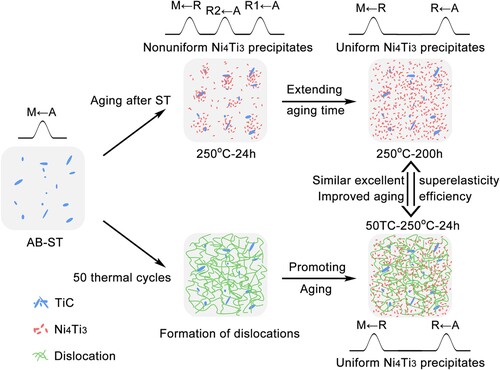
Figure 13. Schematic diagram of accelerated precipitation of Ni4Ti3 particles by introduction of dislocations through thermal cycling treatment.
Supplemental Material
Download MS Word (1.1 MB)Data availability statement
The data that support the findings of this study are available from the corresponding author upon reasonable request.