
Figures & data
Figure 1. (a) Equilibrium phase diagram between 316L SS and K220 Cu. (b) As-built multi-material specimens with K220 Cu in the centre and the SS316 in the periphery. (c) Polished sample with its build direction pointing upwards. (d) Optical image of the cross-section, highlighting three different interfaces, Fe over Cu (Fe/Cu), Cu over Fe (Cu/Fe), and the vertical interface.
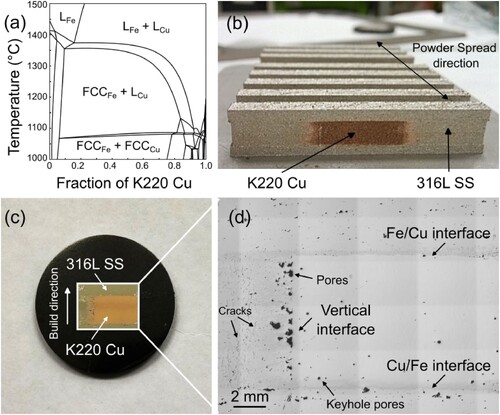
Figure 2. 316L SS over K220 Cu (Fe/Cu) interface. (a) OM image of the Fe/Cu interface. Enlarged SEM image of the (b) top and the (c) bottom of the Fe/Cu interface’s transition zone. (d) EDX mapping of a representative crack within the 316L SS region. (e) EDX line scan across the transition zone. CFD simulations for the (f) first layer, (g) second layer, and (h) third layer LPBF production of 316L SS on K220 Cu. The insets are the fluid flow velocities within the respective melt pools during laser melting.
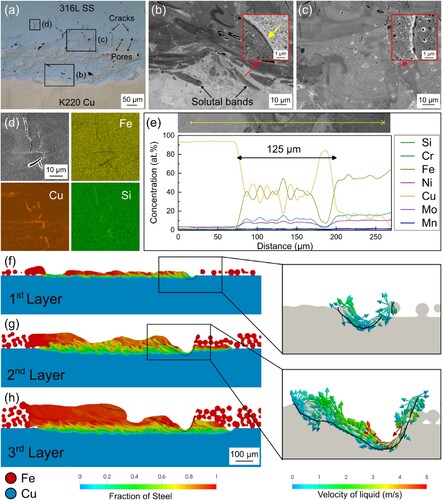
Figure 3. K220 Cu over 316L SS interface. (a) OM image of the Cu/Fe interface. Enlarged SEM image of the (b) top and the (c) bottom of the Cu/Fe interface’s transition zone. (d) EDX mapping of a representative crack within the 316L SS region. (e) EDX line scan across the transition zone. (f) CFD simulations for the keyhole melt pool morphology, and the inset illustrates the fluid flow velocities within the melt pool.
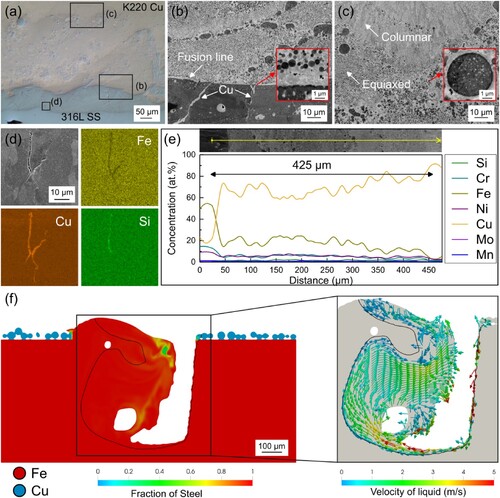
Figure 4. 316L SS and K220 Cu side-by-side vertical interface. (a) A montage of SEM images showing the morphology of various defects and chemical heterogeneities near the vertical interface. CFD simulations of the melt pool size and liquid flow velocities for 316L SS and K220 Cu material mixers with (b) 20 vol.%, (c) 50 vol.%, and (d) 80 vol.% K220 Cu.
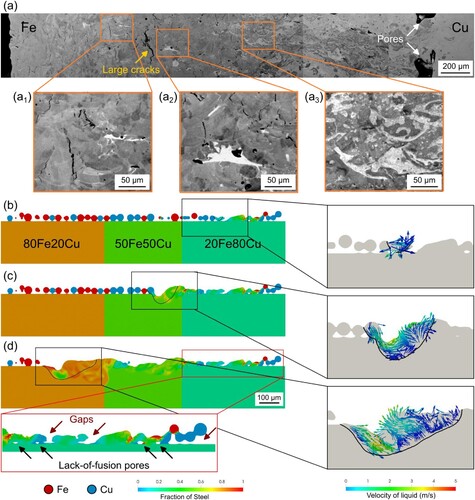
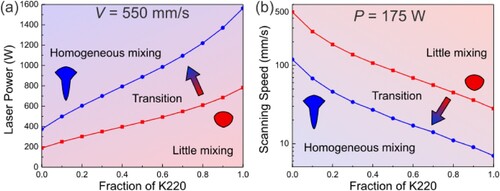
Figure 5. Processing parameter selection maps for the vertical interface between 316L SS and K220 Cu. (a) The required laser power, and (b) the desired laser scanning speed, for different types of material mixing with respect to various K220 fractions. The red and blue curves represent the corresponding processing parameters with the keyhole stability factor Ke = 6 and Ke = 12, respectively.
Data availability statement
The data that support the findings of this study are available from the corresponding author, Z. Sun, upon reasonable request.