
Figures & data
Figure 1. Diagrammatic representation of WADED process and the as-deposited WADED Al-Mg-(Sc-Zr) components.
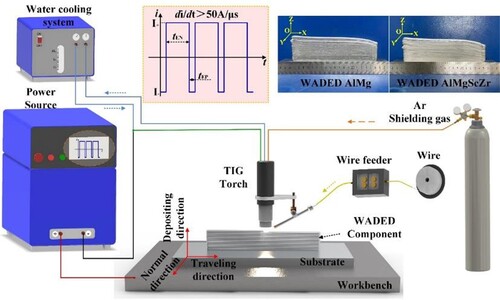
Table 1. Compositions of wire and WADED components.
Table 2. WADED processing parameters.
Figure 2. Schematic illustration of sampling position and tensile sample dimensions.
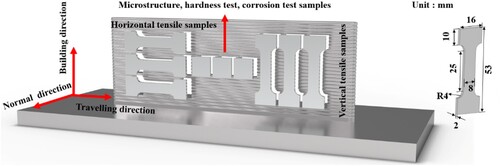
Figure 3. The porosity and statistic results of (a1)–(a3) WADED Al-Mg, (b1)–(b3) WADED Al-Mg-Sc-Zr, (c1)–(c3) WADED Al-Mg-Sc-Zr-HT components.
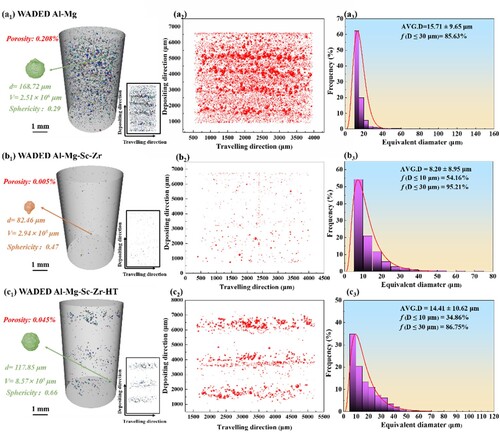
Figure 4. XRD patterns of WADED Al-Mg, Al-Mg-Sc-Zr and Al-Mg-Sc-Zr-HT components.
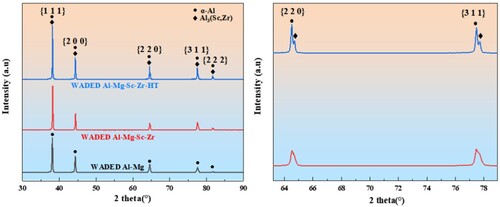
Figure 5. OM morphology of (a) WADED Al-Mg, (b) WADED Al-Mg-Sc-Zr and (c) WADED Al-Mg-Sc-Zr-HT components.
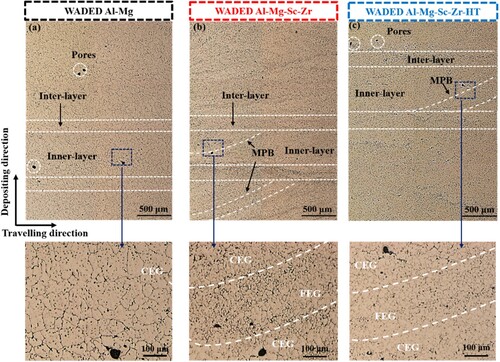
Figure 6. SEM morphology and element mapping of (a1)–(a4) WADED Al-Mg, (b1)–(b4) WADED Al-Mg-Sc-Zr and (c1)–(c4) WADED Al-Mg-Sc-Zr-HT components.
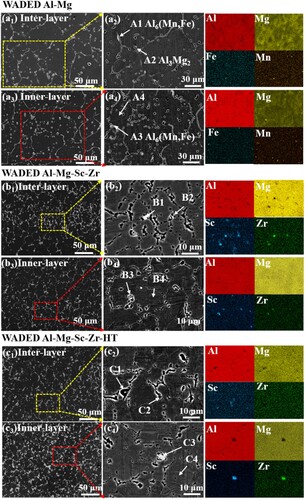
Table 3. Chemical compositions of phase in (at. %).
Figure 7. TEM images and SAED patterns:(a1)–(a3) WADED Al-Mg-Sc-Zr, (b1)–(b5) WADED Al-Mg-Sc-Zr-HT, (b3) HRTEM picture of the matrix and Al3(Sc, Zr) interface, (b4) dislocations shown by inverse Fourier transformation image from the area marked in (b3) on (002) plane, (b5) HRTEM image of Al3(Sc, Zr) particle.
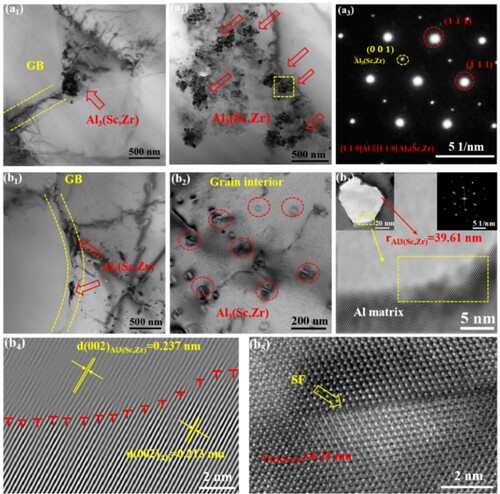
Figure 8. Inverse pole figure EBSD maps, grain size statistical results, grain boundary distribution and pole figures of (a1)–(a4) WADED Al-Mg, (b1)–(b4) WADED Al-Mg-Sc-Zr and (c1)–(c4) WADED Al-Mg-Sc-Zr-HT components.
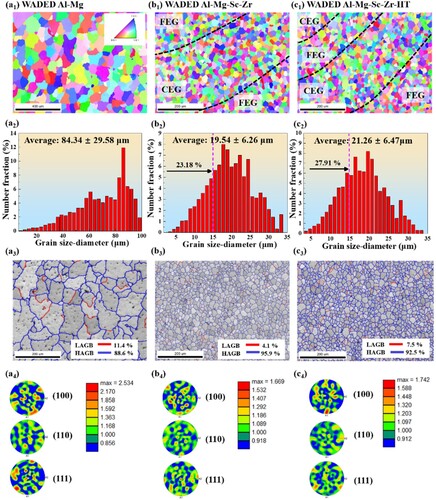
Figure 9. Microhardness of (a) WADED Al-Mg, (b) WADED Al-Mg-Sc-Zr; and (c) WADED Al-Mg-Sc-Zr-HT and (d) the statistic results.
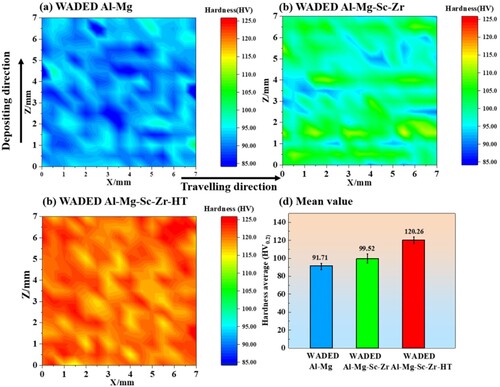
Figure 10. (a) Engineering strain/stress curves, (b) true strain/stress curves (c) statistic results of WADED Al-Mg, Al-Mg-Sc-Zr and Al-Mg-Sc-Zr-HT components and (d) comparison between tensile properties in this work and others in Ref. [Citation8,Citation20,Citation21,Citation30,Citation31,Citation33,Citation43,Citation46,Citation52].
![Figure 10. (a) Engineering strain/stress curves, (b) true strain/stress curves (c) statistic results of WADED Al-Mg, Al-Mg-Sc-Zr and Al-Mg-Sc-Zr-HT components and (d) comparison between tensile properties in this work and others in Ref. [Citation8,Citation20,Citation21,Citation30,Citation31,Citation33,Citation43,Citation46,Citation52].](/cms/asset/c2f8003f-ab94-47d7-a91a-8f2e1f703f9d/nvpp_a_2358981_f0010_oc.jpg)
Figure 11. Side surface fractography of horizontal and vertical direction of (a), (b) WADED Al-Mg, (c), (d) WADED Al-Mg-Sc-Zr and (e), (f) WADED Al-Mg-Sc-Zr-HT components.
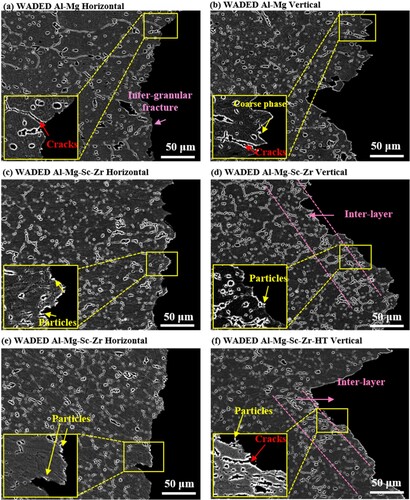
Figure 12. Front surface fractography of (a), (b) WADED Al-Mg, (c), (d) WADED Al-Mg-Sc-Zr and (e), (f) WADED Al-Mg-Sc-Zr-HT components.
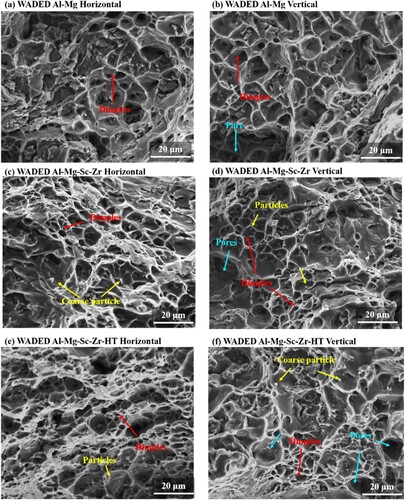
Figure 13. (a) Open-circuit potential and (b) potentiodynamic polarisation curves of WADED Al-Mg, Al-Mg-Sc-Zr and Al-Mg-Sc-Zr-HT samples in 3.5 wt.% NaCl solution.
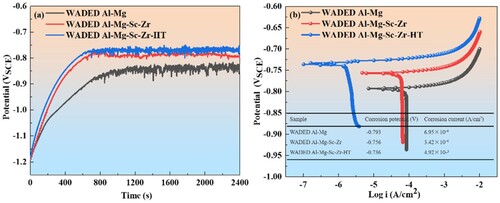
Figure 14. (a) Nyquist and (b) Bode plots of WADED Al-Mg, WADED Al-Mg-Sc-Zr and WADED Al-Mg-Sc-Zr-HT components in 3.5 wt.% NaCl solution.
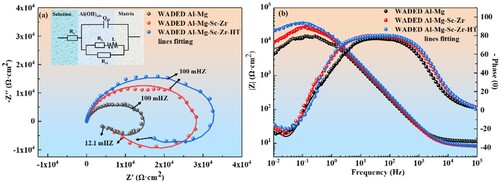
Figure 15. The corrosion morphology and corresponding element mapping of (a1), (a2) WADED Al-Mg, (b1), (b2) WADED Al-Mg-Sc-Zr and (c1), (c2) WADED Al-Mg-Sc-Zr-HT samples.
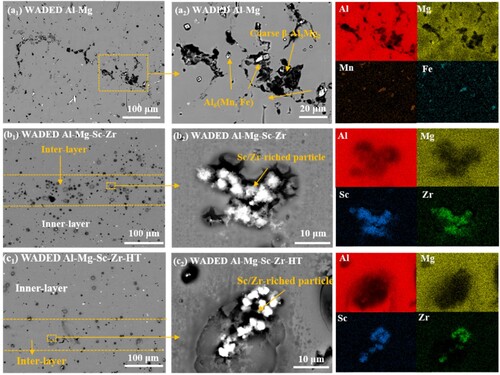
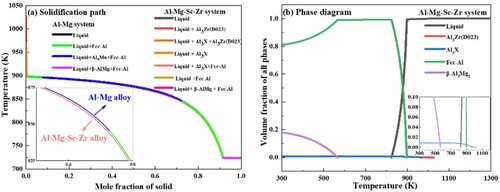
Figure 16. (a) The solidification path of the WADED Al-Mg and Al-Mg-Sc-Zr alloy predicted by the classic Scheil module and (b) the phase diagram obtained from the thermal calc software using the bulk composition.
Data availability statement
Data will be available upon reasonable request.