
Figures & data
Figure 1. Manufacturing and decellularization of the dECM obtained from the porcine meniscus. 1 – native meniscus; 2 – hydrolyzed dECM; 3 – scCO2 variant; 4 – hydrolyzed, treated with DNase dECM; 5 – scCO2 variant. A. Process flow diagram. B. DNA, GAG, and collagen content (n = 3; P* < 0.05, P*** < 0.001).
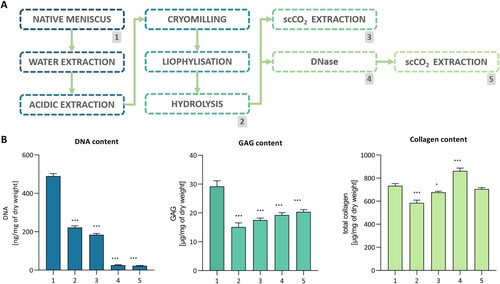
Figure 2. Rheology of the bioinks. A. Amplitude sweeps. B. Temperature sweeps. C. Flow curves.
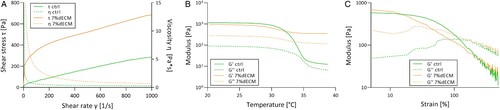
Figure 3. ASC viability determined with the LIVE/DEAD assay. Representative images of m-ASC (pre-cultured as monolayer) and s-ASC precultured as spheroids in the ctrl, and the 7%dECM bioinks (scale bar = 100 µm).
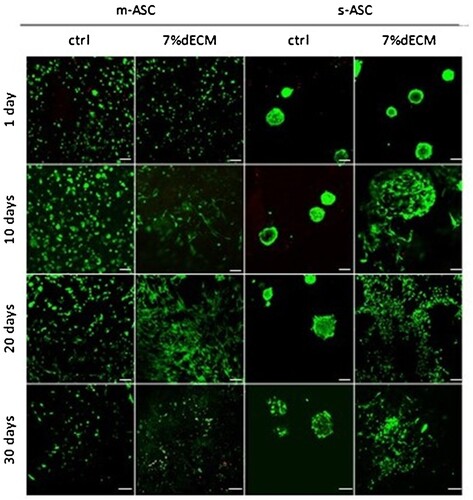
Figure 4. Production of ECM components by ASCs within bioprinted constructs. Representative images of constructs bioprinted with bioinks based on 7%dECM and gelatine-based (ctrl) after 8 weeks of culture. m-ASC – constructs with cell precultured as monolayer, s-ASC – constructs with cells precultured as spheroids.
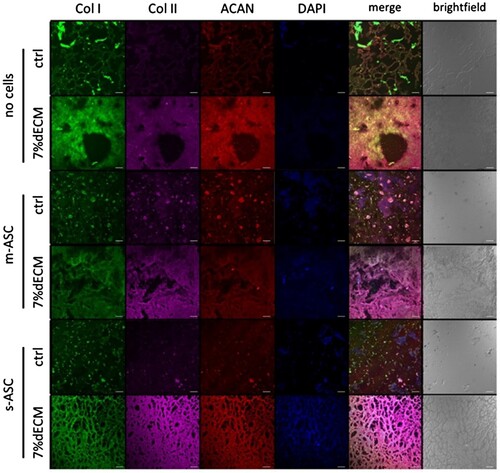
Figure 5. ELISA analysis of proteins secreted by cells into the medium. The cells (m-ASC or s-ASC) were embedded in construct bioprinted with ctrl or 7%dECM at 24 h, 14, 28, and 42 days post-printing. The statistical significance was determined by 2-way ANOVA and calculated for a particular time point compared to day 1 (n ≥ 3; P* < 0.05; P** < 0.01 and P*** < 0.001).
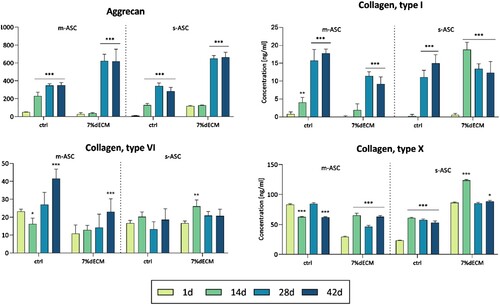
Figure 6. The stress-strain curves of constructs bioprinted with different bioinks (ctrl, 7%dECM) both with and without cells. The measurements were taken within 24 h after production for cell-free constructs, while constructs with m-ASC were assessed at 10 weeks of culture.
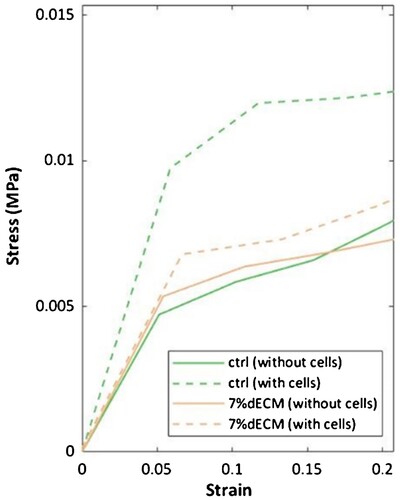
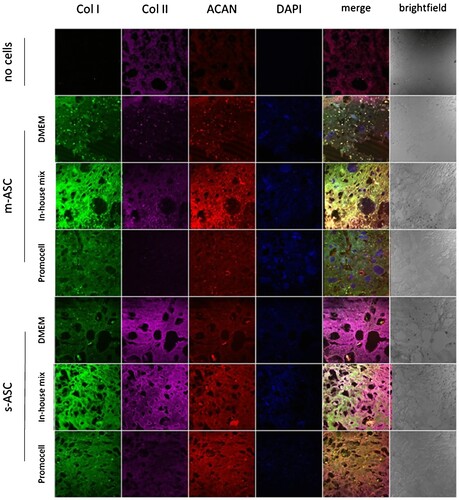
Figure 7. Production of ECM components by ASCs within bioprinted constructs. Representative images of bioinks based on 7%dECM cultured in media DMEM – control media DMEM low glucose with 10% FBS; in-house mix DMEM low glucose with 10% FBS, 50 μg/ml 2-phospho-L-ascorbic acid, 100 ng/ml dexamethason based one, 10 ng/ml TGF-β1, and antibiotics (100 U/ml penicillin, 100 μg/ml streptomycin, and 25 ng/ml amphotericin B); Promocell – Mesenchymal Stem Cell Chondrogenic Differentiation Medium (Promocell).
Supplemental Material
Download Zip (2.7 MB)Data availability statement
The authors confirm that the data supporting the findings of this study are available within the article and its supplementary materials.