
Figures & data
Table 1. Mix proportion (kg/m3).
Figure 1. Experimental tests: (a) unconfined uniaxial compression test (b) shear vane test, (c) ultrasonic pulse velocity test, (d) slow penetration test, and (e) printing test.
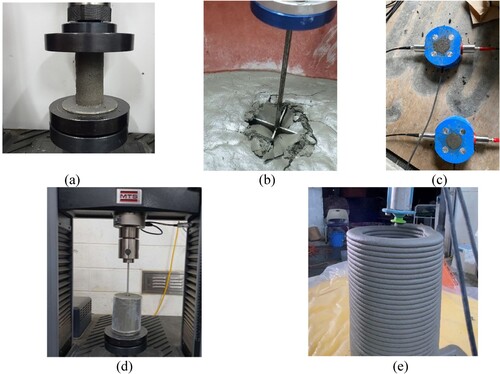
Table 2. Printing strategy for 3DCP with the selected mixtures.
Figure 2. Printing setups for set on demand and stiff mixtures.
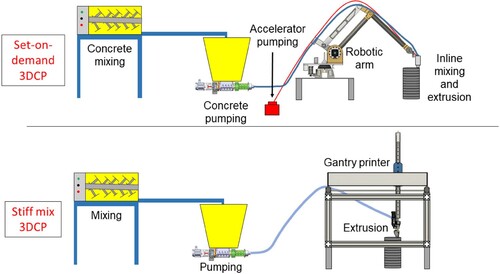
Figure 3. Green strength evolution measured with Uniaxial Unconfined Compression Test for stiff mix (1 K) versus set-on-demand mix (2 K).
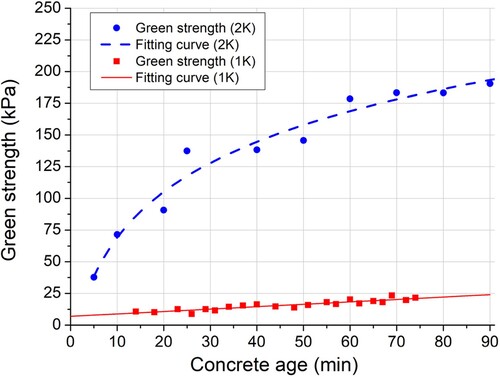
Figure 4. Young's modulus evolution measured with Uniaxial Unconfined Compression Test for stiff mix (1 K) versus set-on-demand mix (2 K).
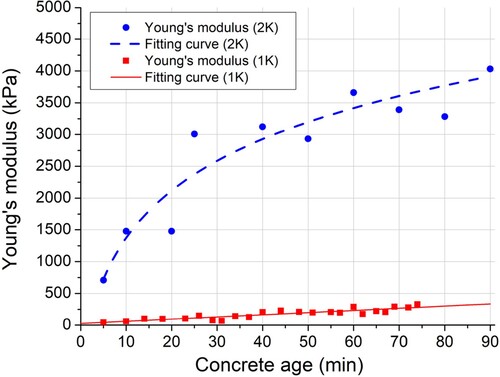
Figure 5. Yield stress measured with shear vane test: stiff mix (1 K) versus set-on-demand mix (2 K).
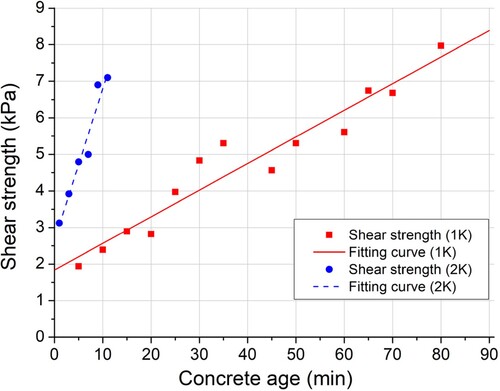
Figure 6. Ultrasonic Pulse Velocity profile of stiff mix (1 K) vs set-on-demand mix (2 K) during early age.
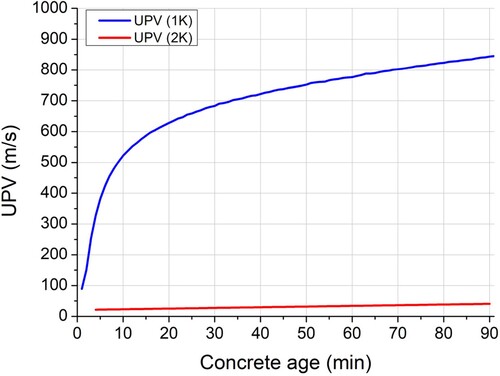
Figure 7. Slow penetration resistance profile of stiff mix (1 K) during vs set-on-demand mix (2 K).
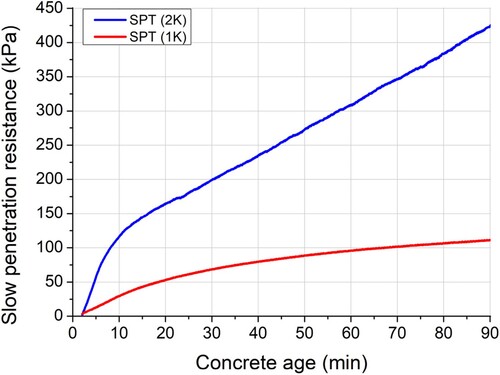
Figure 8. Buildability test using stiff mixture: (a) successful print with the building rate of 0.8 m/hr and (b) plastic failure at the building rate of 1.44 m/hr.
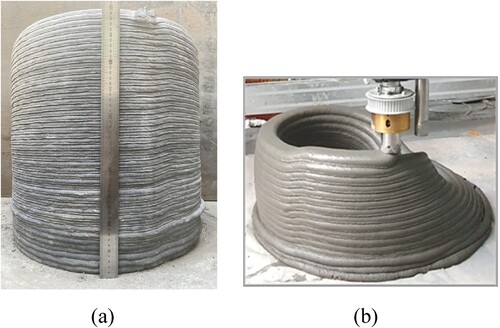
Figure 9. Buildability tests using set-on-demand mixture: (a) successful printing with the building rate of 2.57 m/hr, (b) elastic buckling failure at the building rate of 5.14 m/hr.
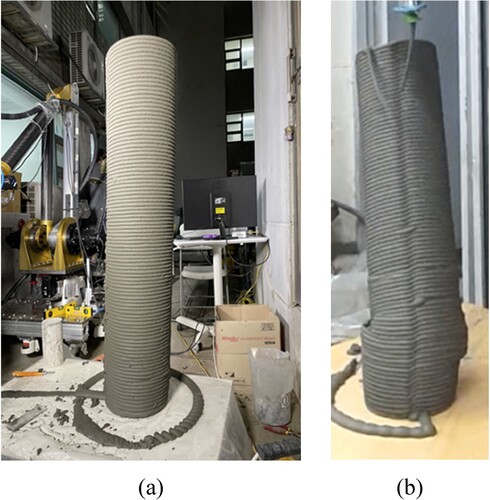
Table 3. Direct printing test results.
Figure 10. Predicted number of layers for plastic failures using the UUCT and shear vane test for the stiff mixture.
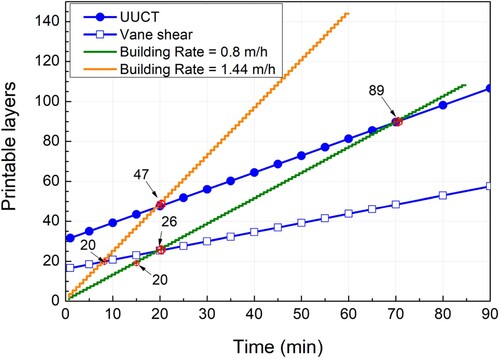
Figure 11. Predicted number of layers for buckling failure using the UUCT result for the set-on-demand mixture.
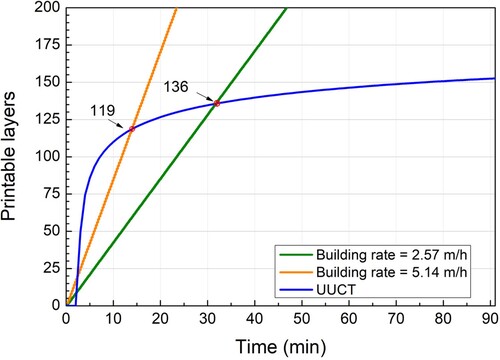
Table 4. Comparison of predicted print failure layer counts from test methods versus actual failure triggering layer counts in direct 3D printing tests.
Data availability statement
The authors confirm that the data supporting the findings of this study are available within the article.