
Figures & data
Figure 1. The overview of the article.
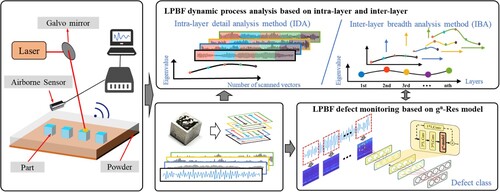
Figure 2. LPBF acoustic signal monitoring system.
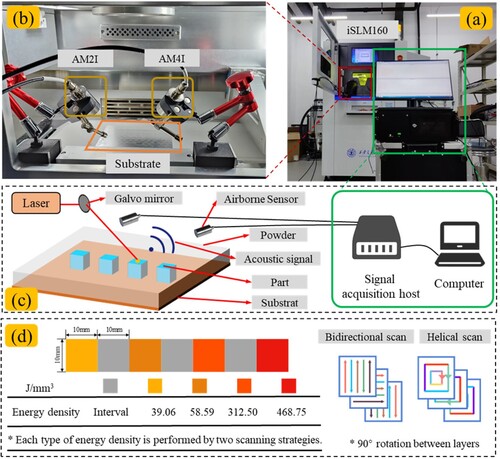
Figure 3. Characterisation of parts and their micromorphology.
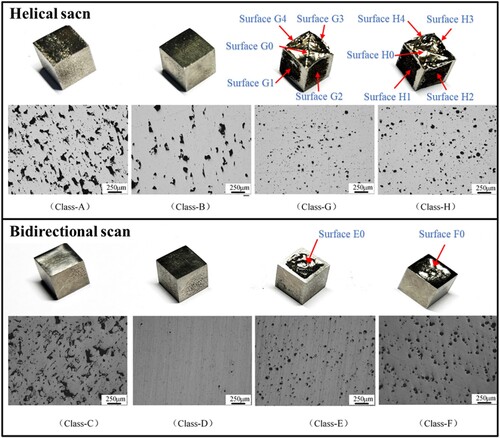
Table 1. Part processing parameters.
Figure 4. Microscopic image processing process based on computer vision.
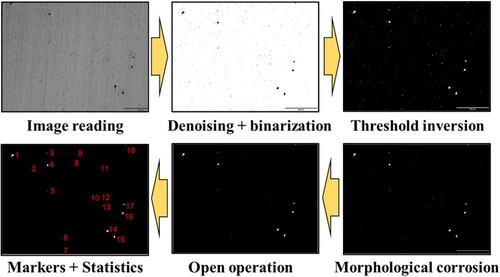
Table 2. Characterisation of pore defect categories and degrees.
Table 3. Deformation defect characterisation.
Figure 5. Intra-layer detail analysis method (IDA) diagram.
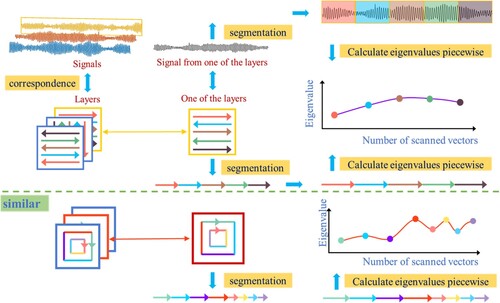
Figure 6. Inter-layer breadth analysis method (IBA) diagram.
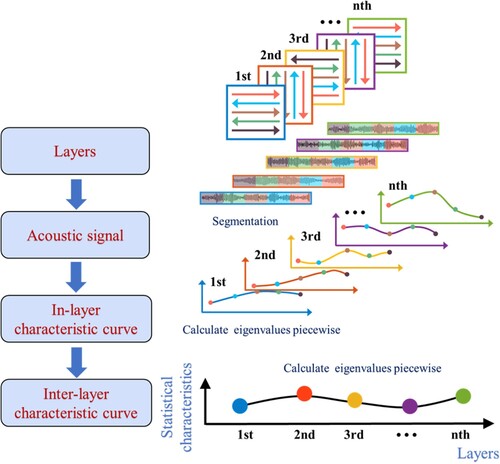
Figure 7. Dynamic real-time analysis of unfused pore energy distribution based on IBA.
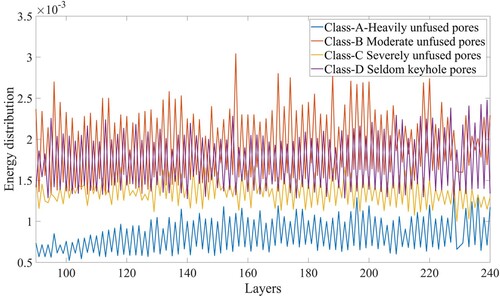
Figure 8. Dynamic real-time analysis of unfused pore energy fluctuation based on IBA.
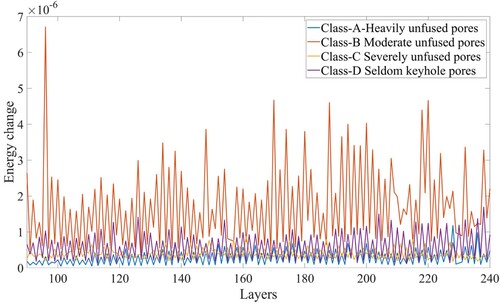
Figure 9. Dynamic real-time analysis of high-frequency percentage of pore defects.
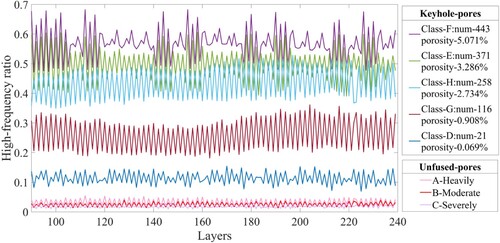
Figure 10. Correlation curve between number of keyholes and proportion of high frequency.
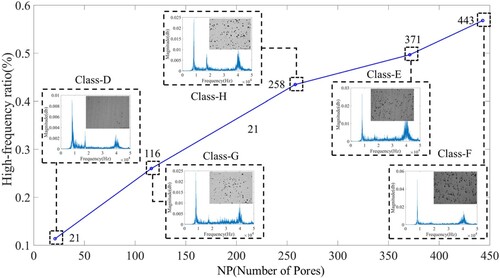
Figure 11. High and low frequency distribution interval.
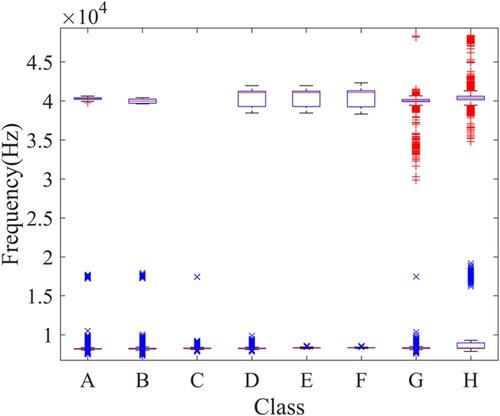
Figure 12. Comprehensive analysis of deformation defect acoustic signal energy phenomenon.
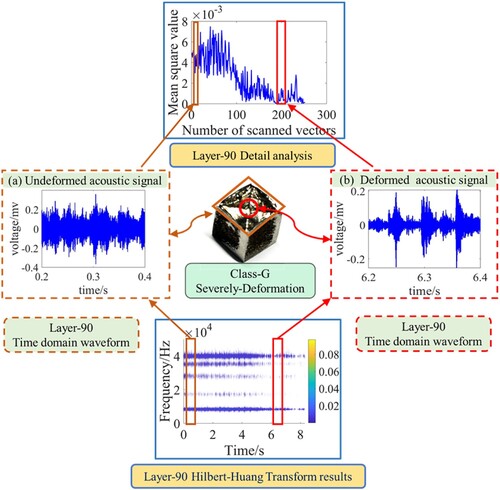
Figure 13. LPBF Online Assessment Generic Process.
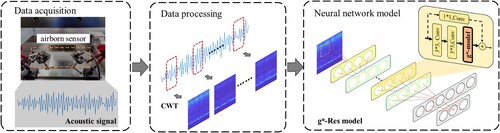
Figure 14. Time-frequency feature map of each class.
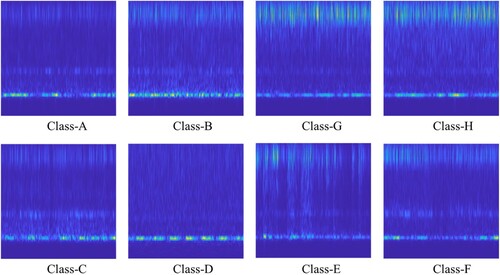
Figure 15. Schematic diagram of gn-SC structure.
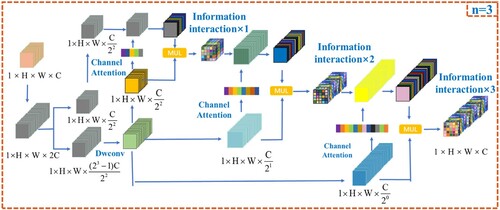
Figure 16. Schematic diagram of gn-CH structure.
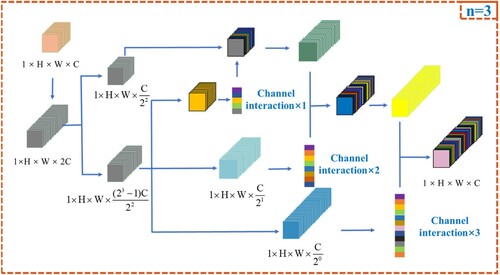
Figure 17. gn-Res model structure.
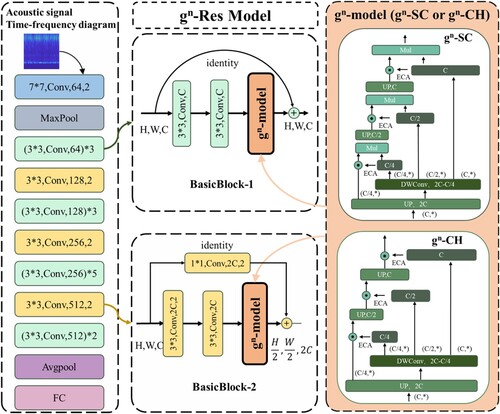
Table 4. Model performance metrics.
Table 5. Parameters used for the model.
Table 6. Performance comparison of high-order interactive modules.
Table 7. Network performance comparison.
Data availability statement
The raw/processed data required to reproduce these findings cannot be shared at this time as the data also forms part of an ongoing study.