
Figures & data
Figure 1. Interactive infill topology optimisation initially applies (a) 50 optimisation iterations using traditional compliance topology optimisation, after which the user (b) draws an infill pattern and (c) defines the region of interest (ROI) to locate the infill pattern. The algorithm resumes using an activated appearance constraint (d) to geometrically guide the optimised material layout for the defined region.
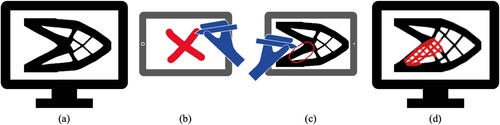
Figure 2. Aesthetic application of passive infill implementation: (a) design inspiration, (b) user drawn region of interest (ROI), (c) passive infill pattern within the ROI having predefined interface connections to the design elements, and (d) converged optimised design.
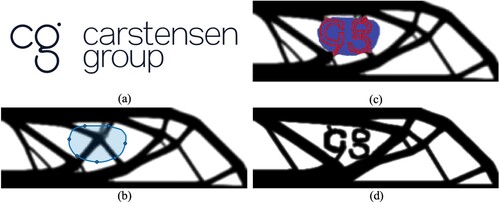
Figure 3. (a) Defined design space for compliance optimisation. (b) Half drawing of a symmetric infill pattern, (c) generate full infill patch, (d) reflect the infill patch across the entire design domain, and (e) at 50 optimisation iterations, interactively overlay the interim topology optimised design to draw a ROI. (f) The guided interactive infill topology optimisation resumes and converges to a design applying the pattern in the ROI. (g) The convergence plot for the compliance, appearance constraint, and volume constraint, where the highlighted portion and hand figure denotes the optimisation iteration where the user enforced the drawn infill pattern.
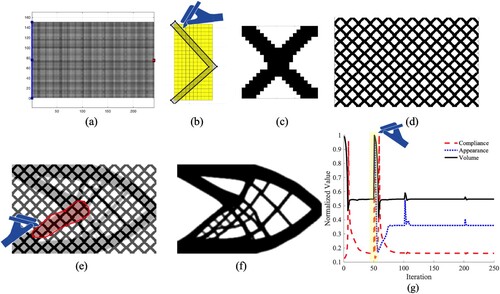
Figure 4. (a) Infill as drawn by the user, (b) passed through the density filter to enforce a minimum length scale feature size, (c) passed through a Heaviside's filter to extrapolate toward a solid/void distribution, and (d) the final binary infill pattern using a threshold cutoff of 0.5.
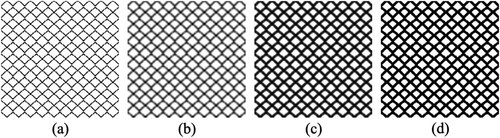
Figure 5. (a) Design domain for a short cantilever design domain. (b) traditional compliance optimised structure, (c) user drawn infill for the patch, (d) full infill pattern for the entire design domain, (e) user drawn ROI on overlaid infill pattern and the interim 50-iteration optimised design, and (f) converged optimised design for guided interactive infill optimisation.
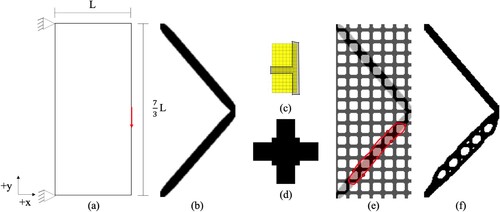
Figure 6. Lowest linear buckling eigenvalue and normalised displacements of the eigenmodes showing the failure location for the (a) traditional compliance optimised short cantilever and the (b) guided interactive infill topology optimised short cantilever, respectively.
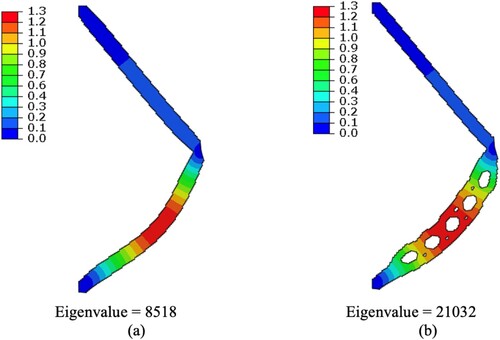
Figure 7. (a) Design domain for a L-bracket. (b) Traditional compliance topology optimised design. (c) Drawn O-infill for the patch, (c) full O-infill pattern, (d) ROI, (e) converged interactive infill topology optimised design.
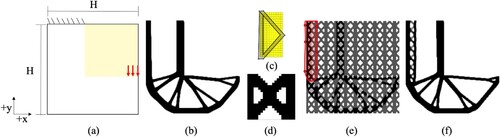
Figure 8. Lowest linear buckling eigenvalue and normalised displacements of the eigenmodes showing the failure location for the (a) traditional compliance optimised L-bracket and the (b) guided interactive infill topology optimised L-bracket, respectively.
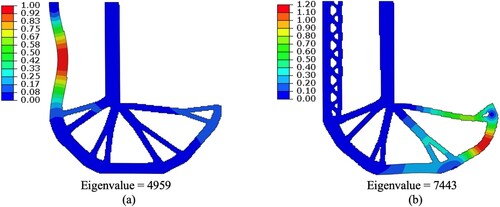
Figure 9. (a) Design domain for a short compressive square. (b) Traditional compliance topology optimised design.
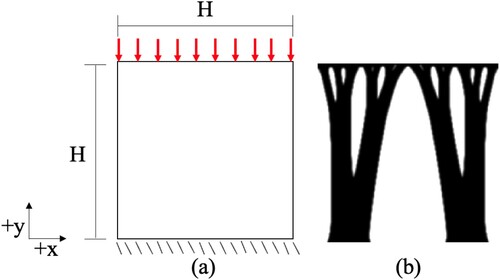
Figure 10. (a) Drawn X-infill for the patch, (b) full X-infill pattern, (c) lower ROI for the X-infill, (d) converged X-infill interactive infill topology optimised design. (e) Drawn O-infill for the patch, (f) full O-infill pattern, (g) lower ROI for the O-infill, (h) converged O-infill interactive infill topology optimised design.
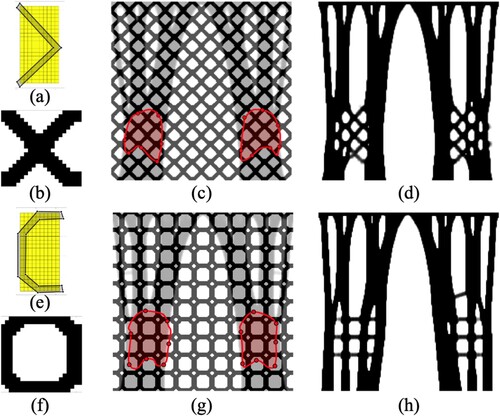
Figure 11. Force-displacement responses and respective plastic strain magnitudes at maximum load for the traditional, X-infill pattern, and O-infill pattern optimised designs.
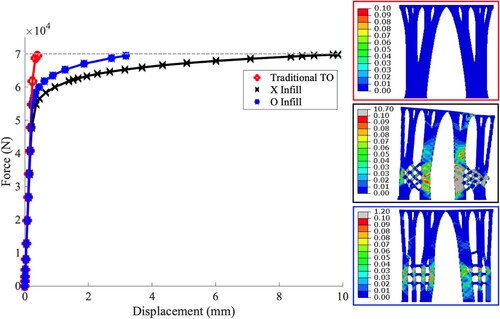
Figure 12. (a) Half symmetrical 2.5D design domain for the MBB beam topology optimisation and (b) the full dimensions of the beam imposed to additively manufacture the 2.5D optimised designs.
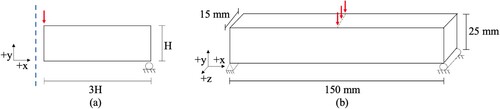
Figure 13. (a) The user draws a symmetrical infill pattern, it is (b) replicated to the full design domain and then repeated across the interim 50-optimisation iteration design upon which (c) the user defines three ROIs for achieving the guided interactive infill optimised designs.
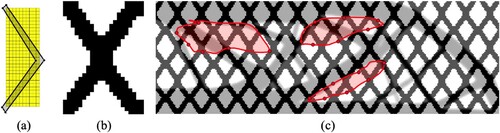
Figure 14. Topology optimised designs considering additive printing requirements printed with support structures (orange printed material), and post-manufacturing removing the support structures from the optimised designs obtained using (a) traditional compliance topology optimisation, (b) overhang constraint, and interactive infill enforced using (c) , (d)
, and (e)
.
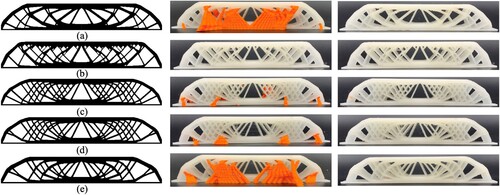
Figure 15. Experimental set-up for the 3-point bending test using a 100 kN Instron machine.
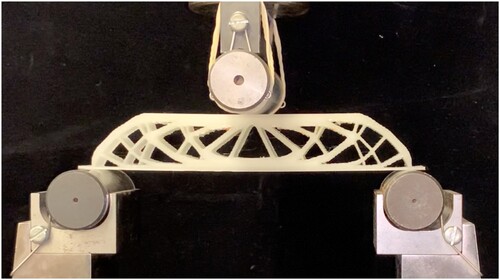
Figure 16. Comparison of compliance for the numerical results and physical experiments, as well as the mass required for support structures in the additive manufacturing process.
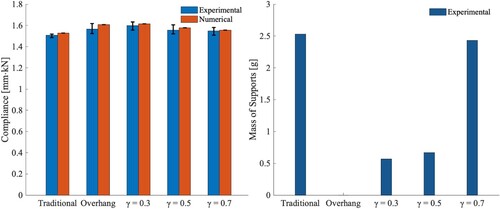
Table 1. Numerical and experimental compliance results for different topology optimised designs considering additive manufacturing requirements.
Data availability statement
The authors confirm that the data supporting the findings of this study are available within the article.