
Figures & data
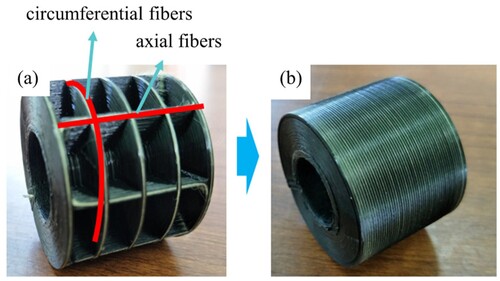
Figure 1. Principle and equipment of 3D printing for CFRC energy absorption tubes, (a) Scheme of the printing process, (b) Equipment for the 3D printing of CFRC energy absorption tubes.
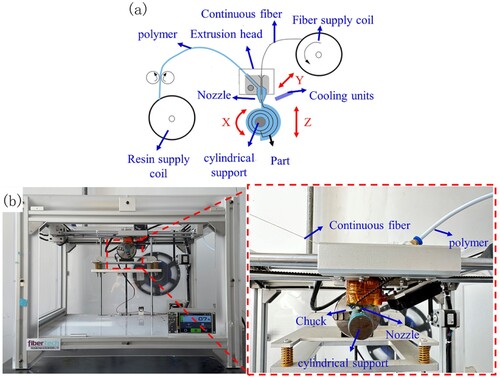
Figure 2. 3D printing path planning for the cylindrical layer.
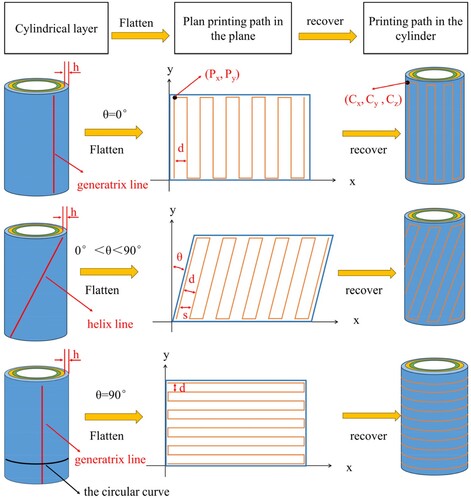
Figure 3. (a) Schematic diagram of the energy absorption tube, (b) Real product photo of the CFRC energy absorption tube with the cylindrical layered 3D printing strategy.
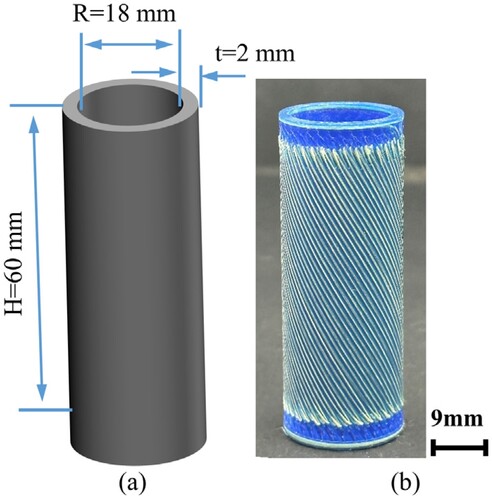
Figure 4. Schematic diagram of the FE model of CFRC energy absorption tube: (a) schematic diagram of determining fibre and resin distribution, (b) establish single fibre and resin models, (c) model assembly.
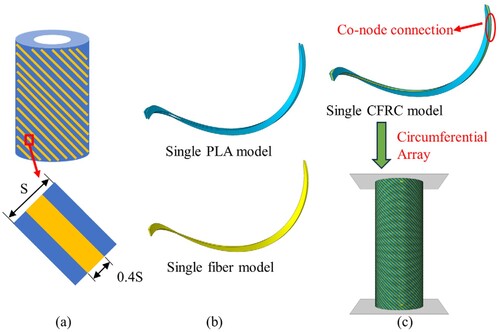
Table 1. Mechanical properties of PLA and Kevlar fibre.
Figure 5. Influence of fibre orientation on compressive performance: (a) Compressive strength and compressive modulus, (b) EA and SEA, (c) CFE and MCF.
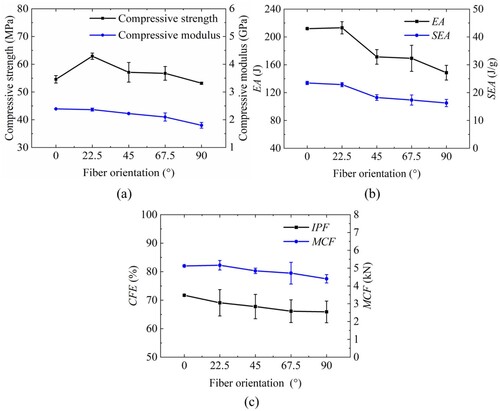
Figure 6. Load-displacement curves of experiment and simulation: (a) All specimens with different θ, (b) θ0°, (c) θ22.5°, (d) θ45°, (e) θ67.5°, (f) θ90°.
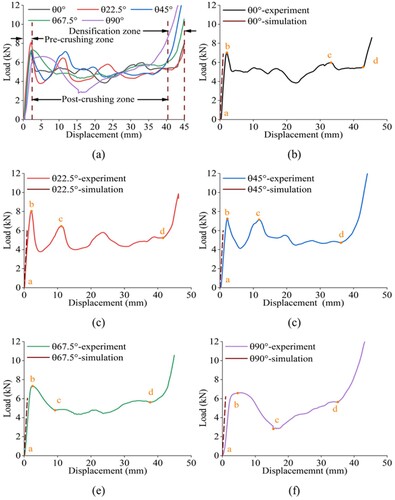
Figure 7. Experimental and simulated failure process with L(displacement) of CFRC energy absorption tubes with different fibre orientation: (a) θ0°, (b) θ22.5°, (c) θ45°, (d) θ67.5°, (e) θ90°.
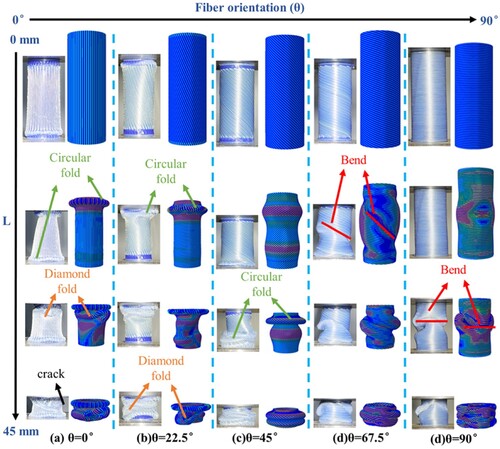
Figure 8. Influence of hatch spacing on compression performance: (a) Compressive strength and compressive modulus, (b) EA and SEA, (c) CFE and MCF.
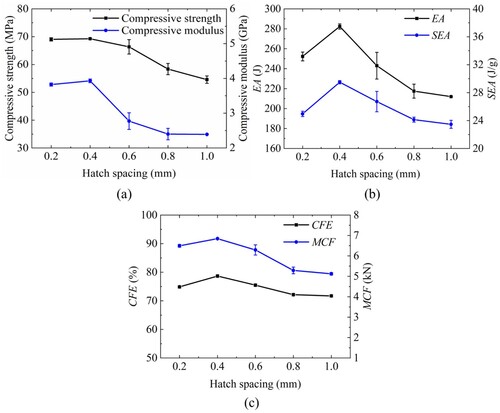
Figure 9. Load-displacement curves of CFRC energy absorption tubes: (a) All specimens with different d, (b) d1, (c) d0.8, (d) d0.6, (e) d0.4, (f) d0.2.
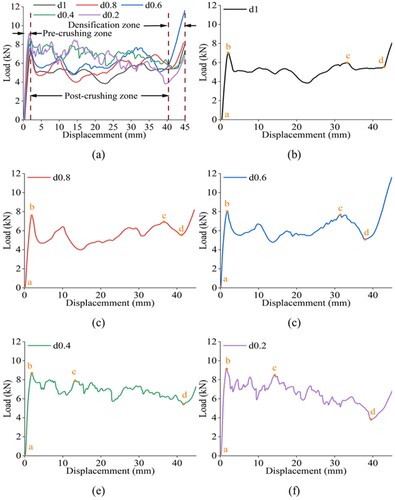
Figure 10. Failure process with L (displacement) of CFRC energy absorption tubes with different hatch spacings: (a) d1, (b) d0.8, (c) d0.6, (d) d0.4, (e) d0.2.
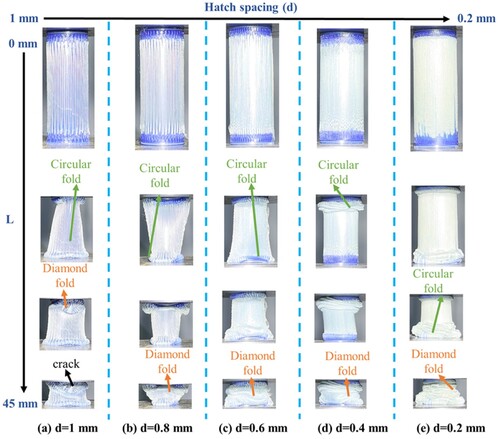
Figure 11. (a) Diagram for calculating fibre content, (b) Fibre content of the 3D-printed CFRC energy absorption tubes with hatch spacings from of 0.2 to 1.0 mm.
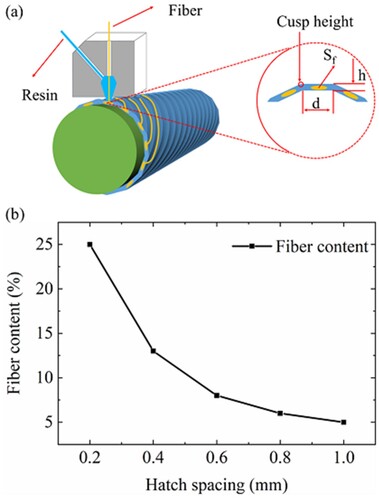
Figure 12. Microstructures and fracture patterns of CFRC energy absorption tubes: (a) Before compression, (b) Resin fracture and fibre bridging after compression, (c) Fibre and resin separation after compression, (d) Delamination after compression.
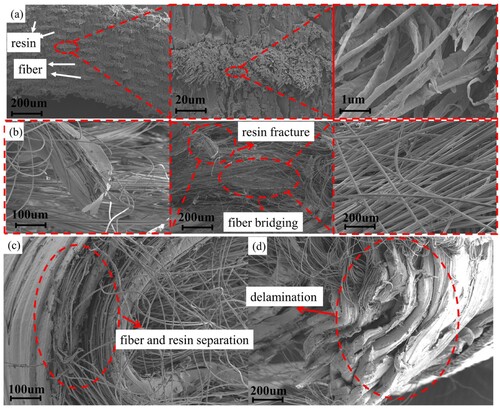
Figure 13. Comparison between cylindrical layered and flat layered: (a) Compressive strength, (b) Compressive modulus, (c) EA, (d) SEA, (e) MCF, (f) CFE.
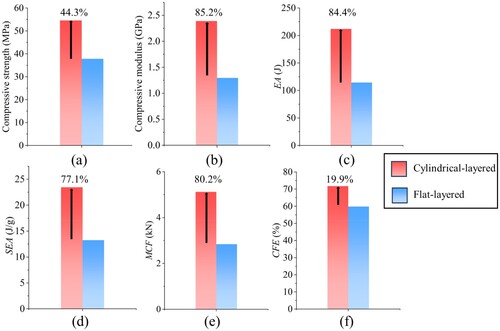
Figure 14. Cusp height analysis model: (a) Cylindrical layered, (b) Flat layered.
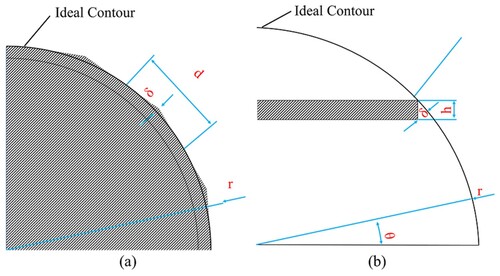
Figure 15. Relationship between cusp height δ and hatch spacing d with different ideal contour radius r in cylindrical layered strategy.
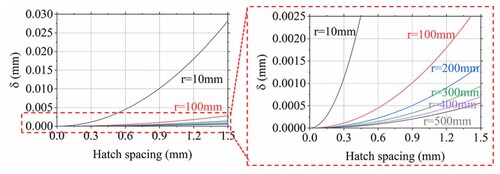
Figure 16. Comparison between cusp height δ of cylindrical layered and flat layered with: (a) Layer thickness h of 0.2 mm, hatch spacing d of 0.2 mm, ideal contour radius r of 100 mm, (b) Layer thickness h of 0.2 mm, hatch spacing d of 0.2 mm, angle of 45°.
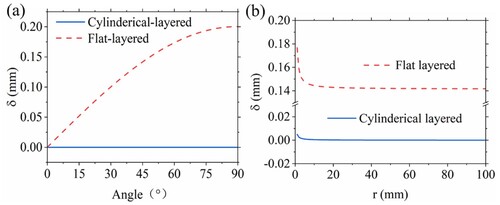
Figure 17. CFRC lightweight energy absorption tube: (a) the inner core (b) the outer skin.
Data availability statement
The data that support the findings of this study are available from the corresponding author (Hou) upon reasonable request.