
Figures & data
Figure 1. Commercial ready-to-use terracotta clay block (left), slump flow test of the SCC mix with a spread range of 500–600 mm (center), and steel fibers (right).
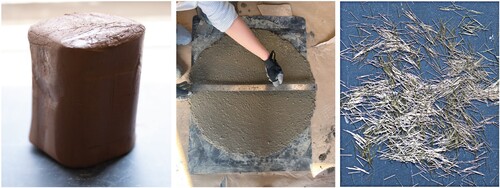
Table 1. Terracotta clay properties.
Table 2. Concrete composition (% of the total mix weight).
Figure 2. Sample trials to fine-tune the SCC mix, and adjust the retarder and accelerator proportions.
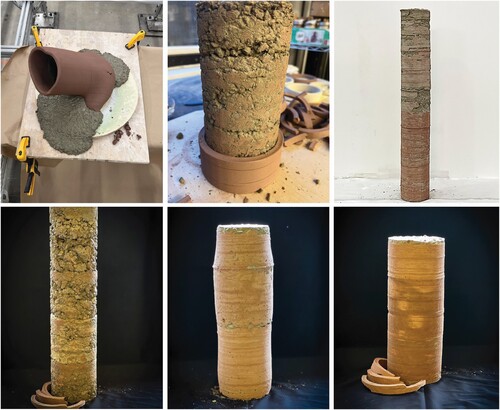
Figure 3. Cylinder samples used in the compression test; samples 2 and 4 showed lower compressive strengths.
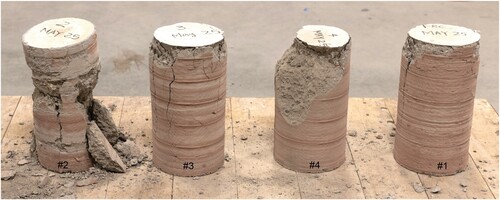
Figure 4. Stress-strain curves under the direct tension for three #5 rebars (Ø = 15.95 mm, ) including the average dynamic values for yield stress
, ultimate stress
, and ultimate strain
.
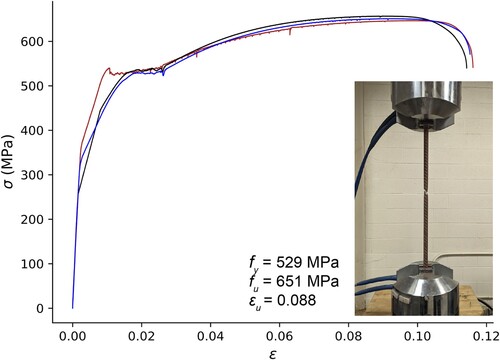
Figure 5. Overview of the fabrication process: (top) printing and casting sequence, and (bottom) removal of the self-detached external formwork, installation of the longitudinal rebars (after the removal of the internal formwork), grouting the void, and the finished beam before screwing the anchorage bolts.
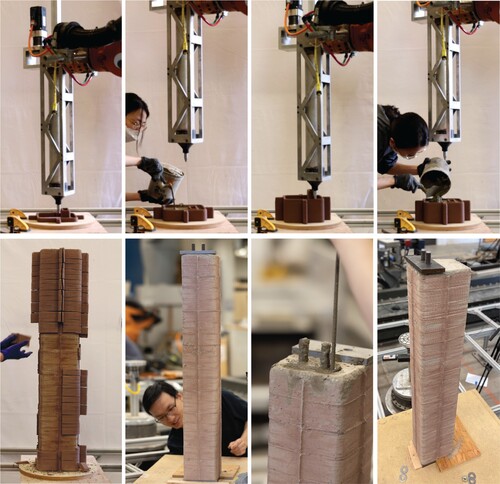
Figure 6. Beam properties and structural test configuration, the dashed lines show the casting layers (dimensions in mm).
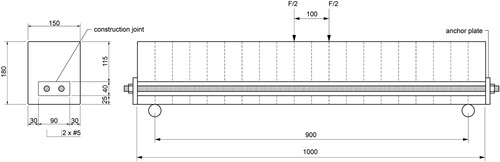
Figure 7. Formwork cross-section with four stiffeners and an internal void: interlayer (left) and mixed (right) fibers.
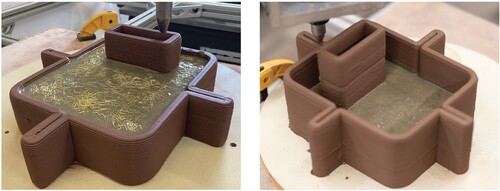
Figure 8. Recycling process: demolded formwork (left), crushed pieces in the fabric (center), kneaded clay ready for extrusion (right).
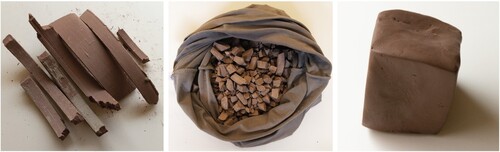
Table 3. Overview of the beam specimens.
Figure 9. Four-point bending test setup with four pairs of kinematic tracking markers installed on the beam's surface.
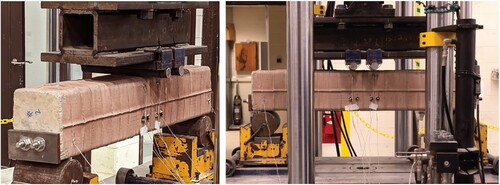
Figure 10. The three beams fabricated with 3D-printed clay formwork; the beam with recycled and reused clay is on the right side, with the exterior formwork just removed.
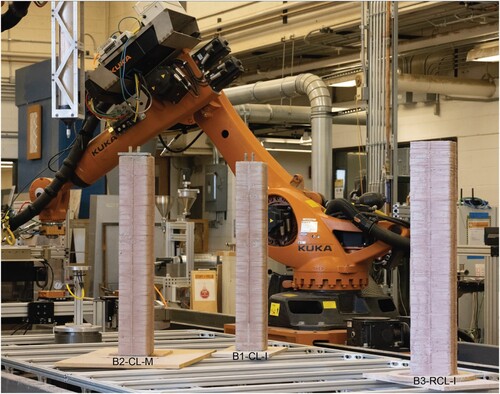
Table 4. Terracotta clay properties (non-recycled vs. recycled).
Figure 11. Formwork deformations as: (top) histograms with a bin size of 0.5 mm, and (bottom) heat maps with reported average (μ), median (η), and standard deviation (σ). The continuous vertical red/yellow lines in the heat maps are related to ridges caused by the formwork stiffeners and can be ignored.
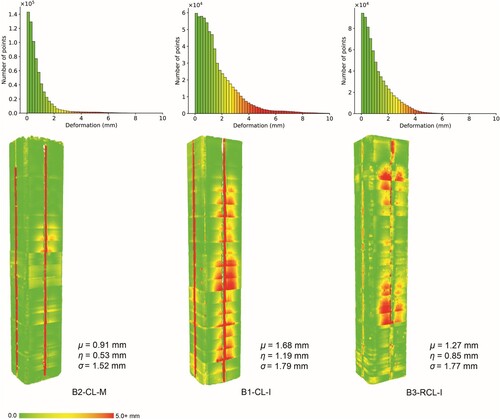
Figure 12. Load-displacement behaviour. shows the values at the ultimate load marked with circles and their corresponding deformation. The curve for B1-CL-I is not presented because of the premature anchorage failure.
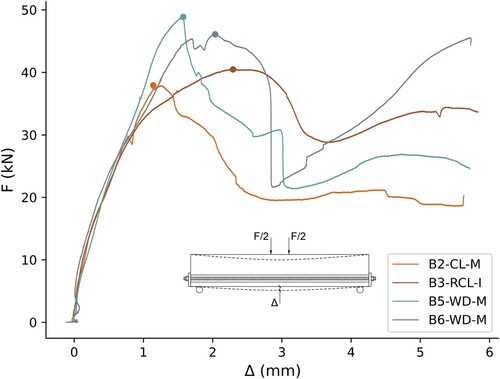
Table 5. Summary of the test results presented in , is the ultimate load and
is the mid-span deflection at
.
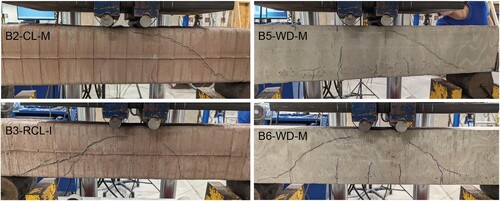
Figure 13. Diagonal tension shear failure of the four tested beams close to failure (80-90% of the peak load).
Data availability statement
The data for this study is available at the following DOI link: https://doi.org/10.34770/d6kk-qt95
.