
Figures & data
Figure 1. Representative SEM images of APGD samples subjected to hydrolytic degradation. Scale bar = 200 µm.
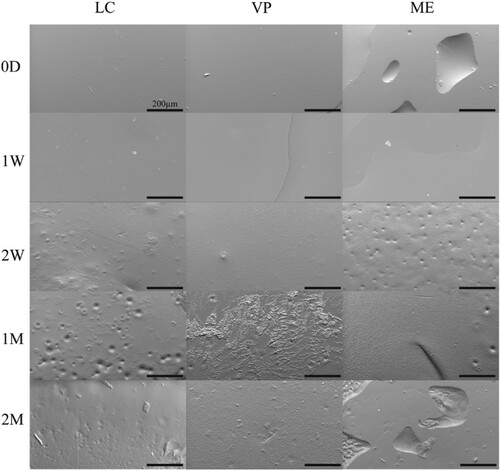
Figure 2. Representative SEM images of APGD samples subjected to enzymatic degradation. Scale bar = 200 µm.
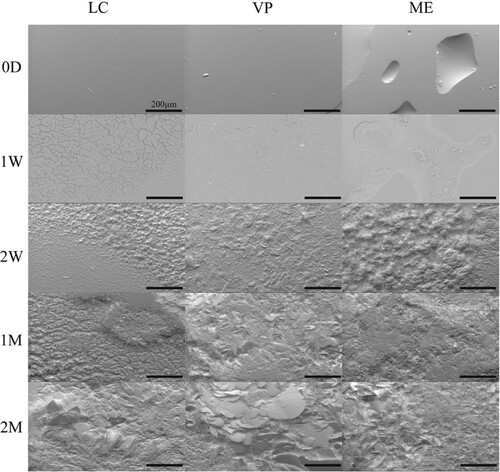
Figure 3. Representative SEM images of APGD samples after implantation in a subcutaneous mouse model. Scale bar = 200 µm.
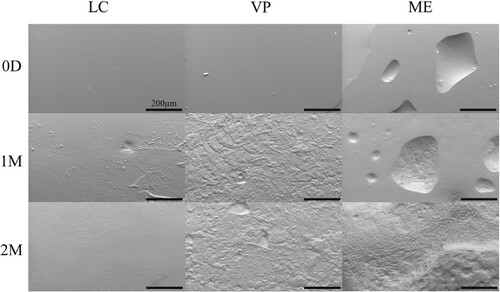
Figure 4. APGD mass and volume loss over 2 month (A/B) hydrolytic, (C/D) enzymatic, and (E/F) in vivo degradation assays. Data are expressed as mean ± SD ((A/B) n = 4–6, **p < 0.01 vs. VP and ME across all timepoints, (C/D) n = 4–6, ***p < 0.0001 vs. LC and VP across all timepoints, (E/F) n = 9–10, *p < 0.05 for all groups across all timepoints, **p < 0.01 for all groups across all timepoints, ###p < 0.0001 for all groups vs. time). Significance was assessed via Two-way ANOVA with Tukey’s post test.
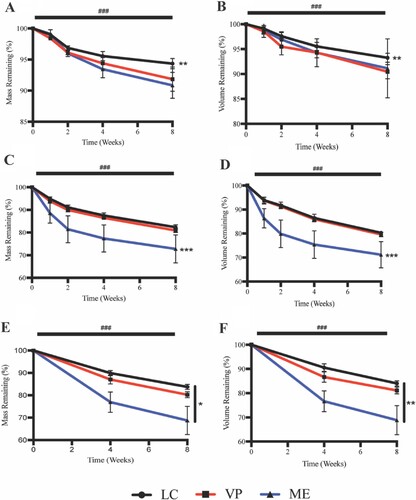
Figure 5. APGD Tm and ΔHfusion over 2 month (A/B) hydrolytic, (C/D) enzymatic, and (E/F) in vivo degradation assays. Data are expressed as mean ± SD ((A/B) n = 3, **p < 0.01 for LC vs. VP and ME across all timepoints, (C/D) n = 3, *p < 0.05 for LC vs. VP and ME across all timepoints, (E/F) n = 3, *p < 0.05 for ME vs. LC and VP across all timepoints, ###p < 0.0001 for all groups vs. time). Significance was assessed via Two-way ANOVA with Tukey’s post test.
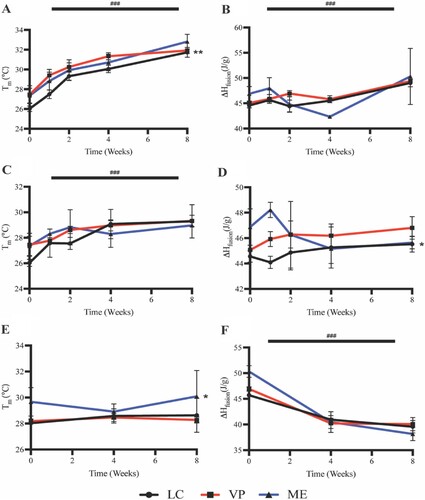
Figure 6. FTIR spectrograms of representative VP samples under (A) hydrolytic, (B) enzymatic, and (C) in vivo degradation assays. (A) i: OH stretch, ii: carbonyl stretch, iii: CO ester stretch, (B) i: OH stretch (carboxylic acid) ii: carbonyl stretch, iii: COH bend, iv: CO ester stretch, v: OH bend (C) i: OH stretch, ii: amine stretch, iii: carbonyl stretch, iv: amide stretch peaks.
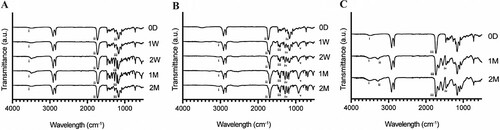
Figure 7. Mass spectrometry data of recovered supernatant from APGD in vitro degradation assays showing the presence of 3 major analytes measured across all APGD samples. (A) Heat map showing a normalised concentration measurement of the 3 major analytes in each sample relative to all samples tested. Green and red indicate smaller and larger relative concentrations of each analyte respectively (brackets indicate p < 0.05). Graphs of the raw normalised area data for (B) C12H22O4, (C) C15H28O6, and (D) C18H34O8 measured in all APGD samples. Significance was assessed via hierarchical cluster analysis (*p < 0.05 for all hydrolytic vs. enzymatic samples).
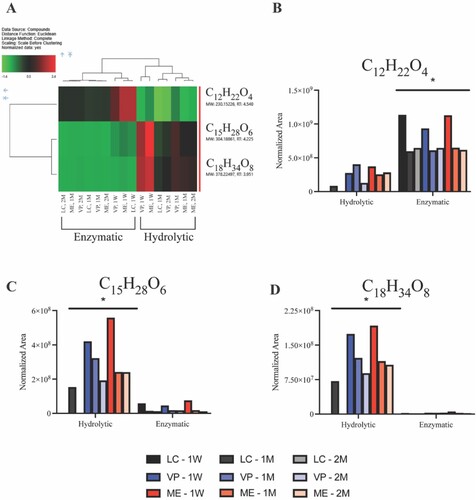
Figure 8. Representative photographs of APGD explants collected from subcutaneous mouse models at 1 and 2 month timepoints. Black arrows label blood vessels and red arrows label inflammatory fibrous encapsulation.
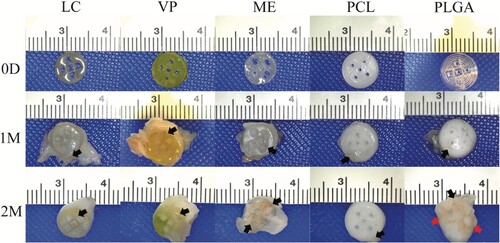
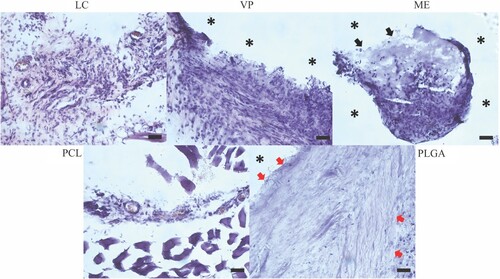
Figure 9. Representative images of 2M histology samples with H&E staining. * denotes the location of clearly identifiable implant material that did not survive the sectioning and/or staining process. Black arrows label the location of APGD material that survived the sectioning and staining process. Red arrows highlight inflammatory fibrous encapsulation. Scale bar = 50 µm.
Supplemental Material
Download MS Word (28.1 MB)Data availability statement
The data that support the findings of this study are available from the corresponding author, RA, upon reasonable request.