
Figures & data
Figure 1. The wire-based ULDED experiment system.
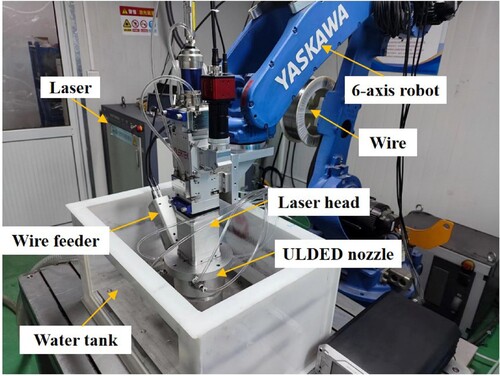
Figure 2. Diagram of the X-ray high-speed imaging system.
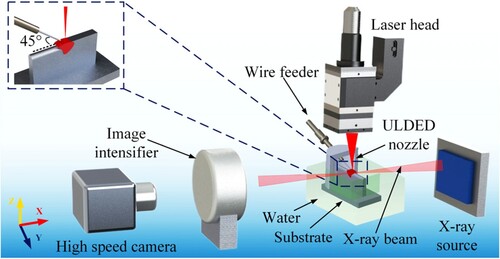
Table 1. Chemical composition of the Ti-6Al-4V alloy.
Table 2. Process parameters of the single-bead experiments.
Table 3. Process parameters of the 10-layer thin walls.
Table 4. Process parameters of 60-layer thin walls.
Figure 3. Positions of metallographic structure and tensile testing specimens.
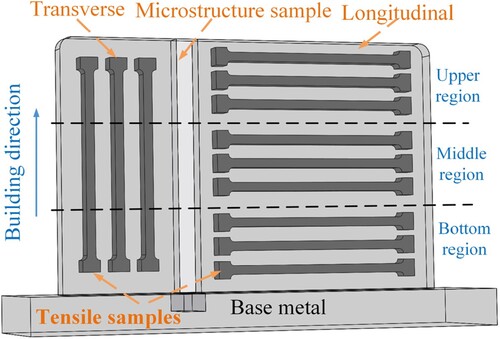
Figure 4. The flowing pattern of residual water during the ULDED process and surface appearance, profile and cross section of single beads at different gas flow rates. (a) 10 L/min. (b) 14 L/min. (c) 18 L/min. (d) 20 L/min. (e) 20 L/min.
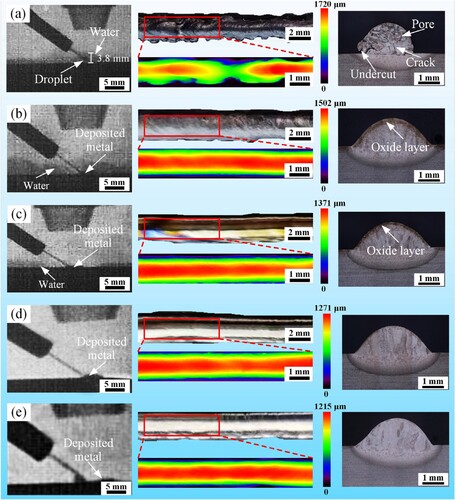
Figure 5. (a) The depth of residual water layer in local dry cavity during UWLD process at different gas flow rates. High-speed imagines around the laser irradiated zone at (b) 10 L/min. (c) 14 L/min. (d) 18 L/min. (e) 20 L/min. (f) 30 L/min gas flow rates.
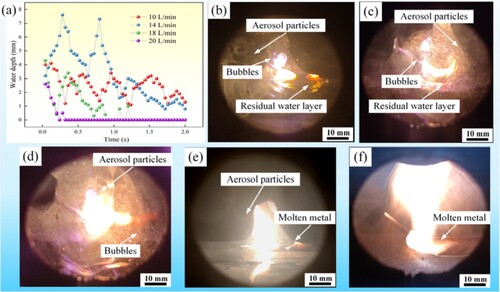
Figure 6. (a) Wire melting and mass transfer process in droplet transfer mode. (b, c) Schematic diagram of heating and force analysis on the droplet. (d) Schematic diagram of force analysis in the liquid bridge.
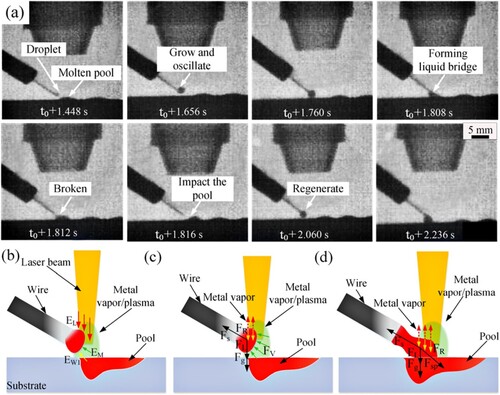
Figure 7. Surface appearance of the single track in (a) droplet transfer mode. (b) liquid transfer mode and (c) spreading transfer mode.
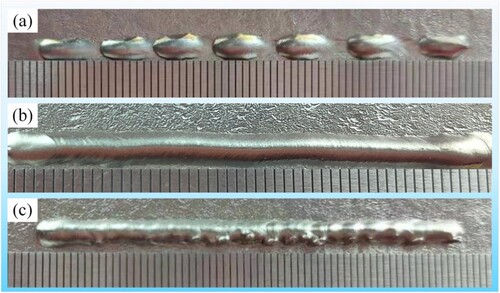
Figure 8. (a) Wire melting and mass transfer process in liquid bridge transfer mode. (b, c) Schematic diagram of heating and force analysis.
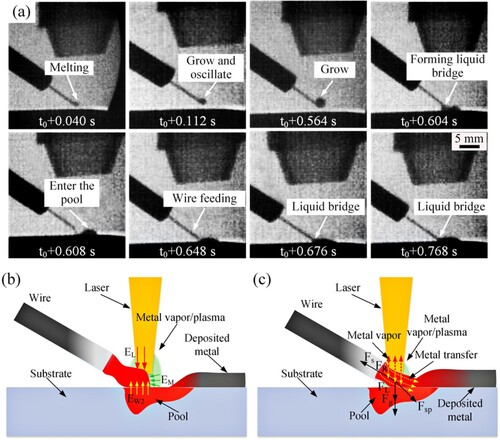
Figure 9. (a) Wire melting and mass transfer process in spreading transfer mode. (b, c) Schematic diagram of heating and force analysis.
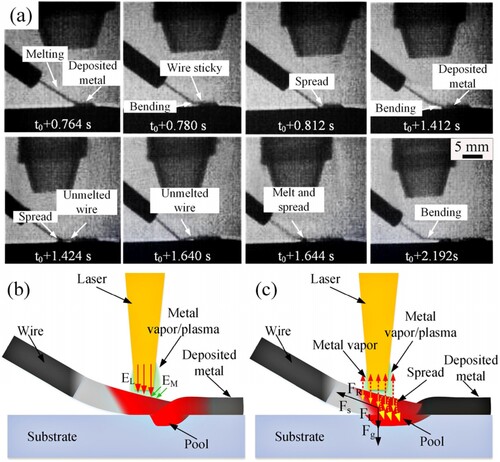
Figure 10. Mass transfer behaviours during ULDED thin-wall samples manufacturing process at 0.5 mm interlayer increment. (a) First layer. (b) Second layer. (c) Third layer. (d) Seventh layer.
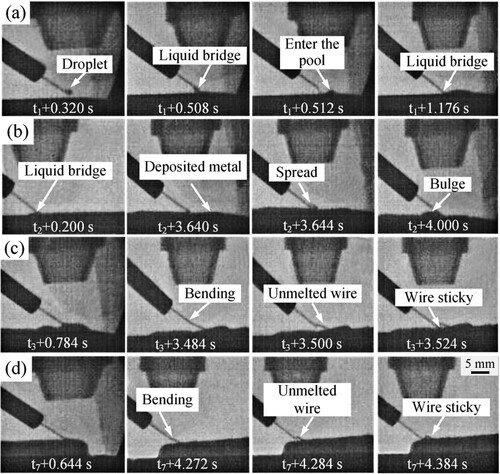
Figure 11. Mass transfer behaviours during ULDED thin-wall samples manufacturing process at 0.9 mm interlayer increment. (a) First layer. (b) Second layer. (c) Fifth layer. (d) Ninth layer.
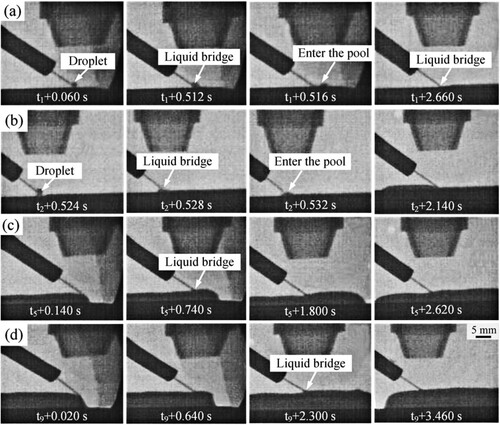
Figure 12. Mass transfer behaviours during ULDED thin-wall samples manufacturing process at 1.1 mm interlayer increment. (a) First layer. (b) Second layer. (c) Seventh layer. (d) Ninth layer.
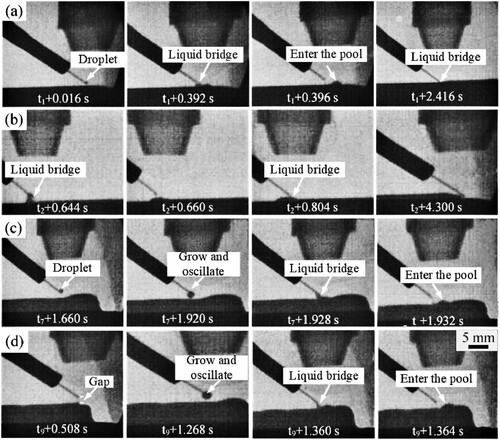
Figure 13. Surface morphology of ULDED thin-wall samples at different interlayer increments. (a) 0.5 mm. (b) 0.7 mm. (c) 0.9 mm. (d) 1.1 mm.
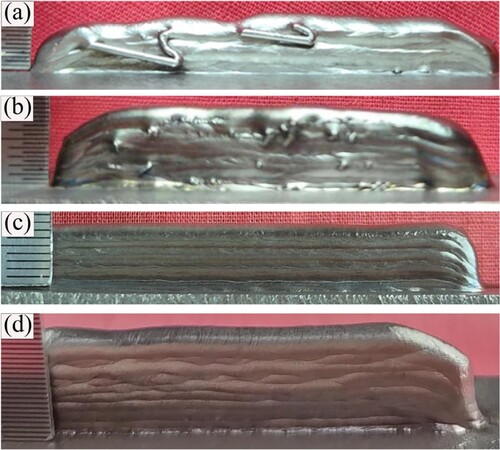
Figure 14. Schematic diagram of heating and force analysis during ULDED thin-wall samples manufacturing process at 0.5 mm interlayer increment. (a1, a2) First layer. (b) Second layer. (c1, c2) Subsequent layer.
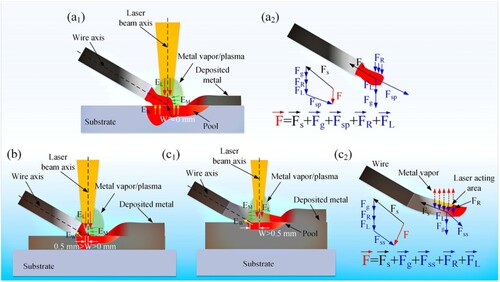
Figure 15. Schematic diagram of heating and force analysis during ULDED thin-wall samples manufacturing process at 1.1 mm interlayer increment. (a) Initial stage. (b, c) Subsequent stage.
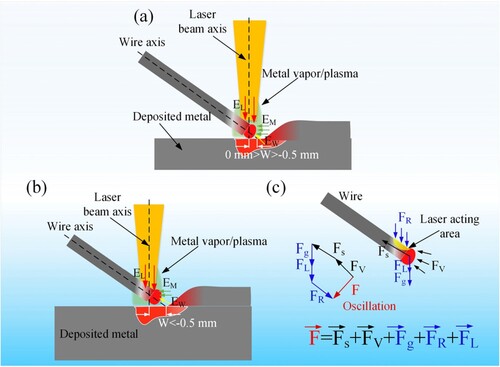
Figure 16. Surface morphology of thin-wall samples at different heat inputs. (a) 200 W/mm. (b) 250 W/mm. (c) 312.5 W/mm.
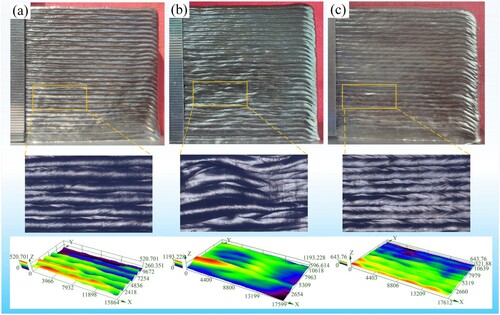
Figure 17. Cross sections in bottom, middle and upper regions of thin-wall samples at different heat inputs. (a) 200 W/mm. (b) 250 W/mm. (c) 312.5 W/mm.
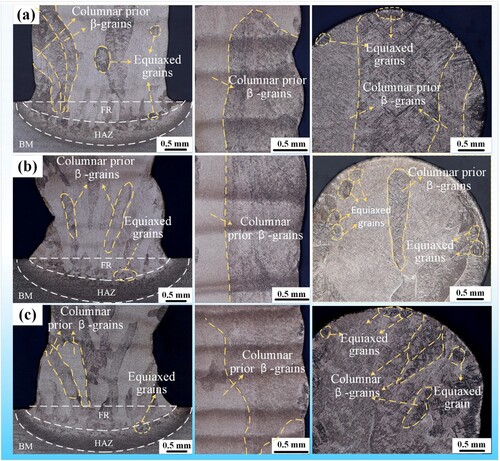
Figure 18. Microstructures mechanical properties of ULDED walls at different heat inputs. (a1) Bottom region, 200 W/mm. (a2) Bottom region, 250 W/mm. (a3) Bottom region, 312.5 W/mm. (b1) Middle region, 200 W/mm. (b2) Middle region, 250 W/mm. (b3) Middle region, 312.5 W/mm. (c1) Top region, 200 W/mm. (c2) Top region, 250 W/mm. (c3) Top region, 312.5 W/mm. (d) Tensile strength. (e) Elongation.
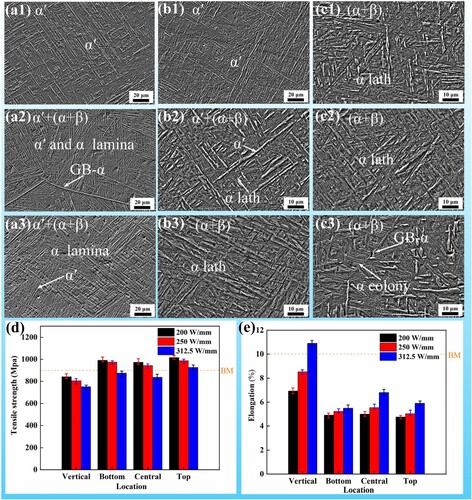
Figure 19. EBSD IPF maps for α/α′ phase in (a) top region and (b) bottom region of the ULDED wall constructed at 200 W/mm. (c) The reconstruction of prior-β grains based on (b). (d) α/α′ and β pole figures within the prior-β grain delineated by black lines in (a). (e) Three selected α plates from (b). (f) Pole figures of selected α grains in (e).
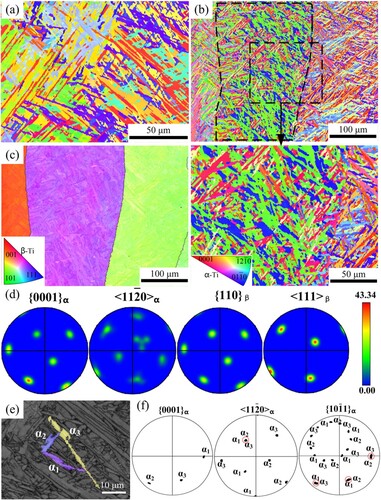
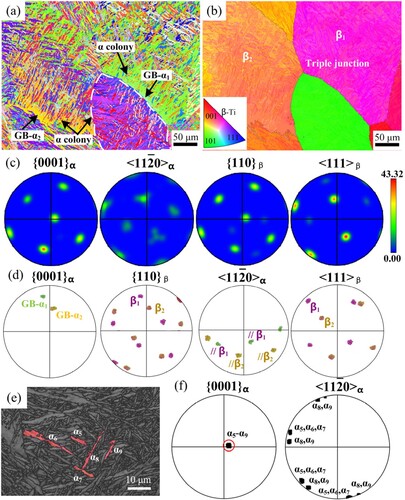
Figure 20. (a) EBSD IPF maps for α phase in bottom region of the ULDED wall constructed at 312.5 W/mm. (b) The reconstruction of prior-β grains based on (a). (c) α and β pole figures within the prior-β grain delineated by white lines in (a). (d) Pole figures of Selected GB-α plates in (a) and prior-β grains in (b). (f) Pole figures of selected α grains from two colonies in (e).
Data availability statement
The data presented in this study are available on request from the corresponding author.