
Figures & data
Table 1. Chemical composition of ER70S-6 wire and 316L substrate used (wt. %).
Figure 1. (a) A photo showing the appearance of the WAAM-built ER70S-6 on 316L substrate (the insert showing the zig-zag building strategy); (b) macrostructure of the WAAM-built ER70S-6 on 316L substrate.
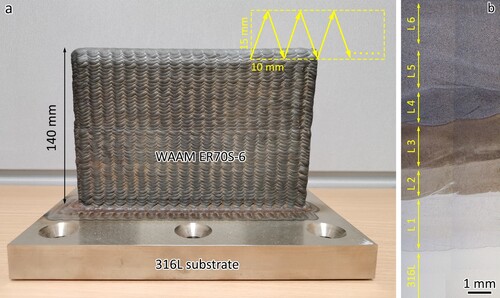
Table 2. Parameters used for the WAAM-plasma process.
Figure 2. EDS line scan of the 316L/ER70S-6 interface and the first few layers.
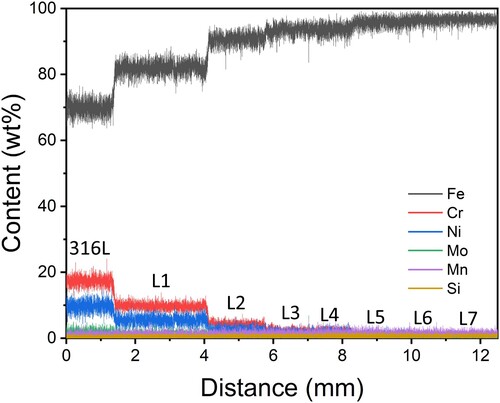
Table 3. Chemical composition (wt%) of different layers measured using EDS mapping.
Figure 3. EBSD orientation maps of the 316L substrate and the first six layers of the WAAM-fabricated bimetal structure, (a) 316L substrate, (b) layers 1 and 2, (c) layer 3, (d) layer 4, (e) layer 5 and (f) layer 6.
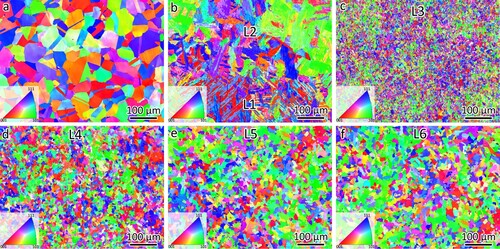
Figure 4. Optical images showing the bainite microstructure in (a) layer 1 and (b) layer 2. SEM images showing the bainite microstructure in (c) layer 1 and (d) layer 2.
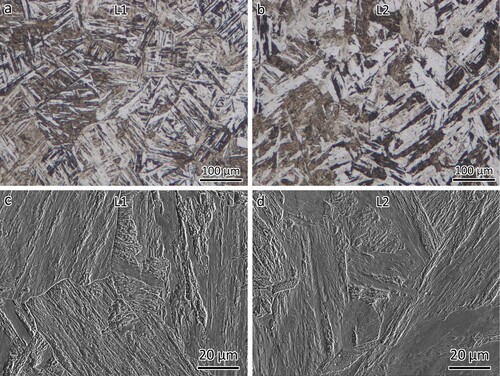
Figure 5. SEM images showing the microstructures of (a) layer 1, (b) layer 2, (c) layer 3, (d) layer 4, (e) layer 5 and (f) layer 6.
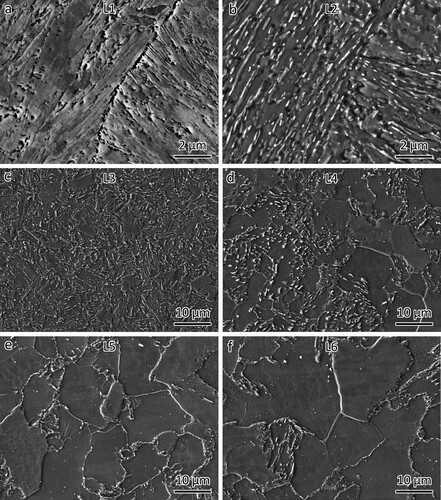
Figure 6. Thermo-Calc equilibrium simulations showing the volume phase fractions as a function of temperatures using the chemical composition of (a) 316L substrate, (b) layer 1, (c) layer 2 and (d) ER70S-6.
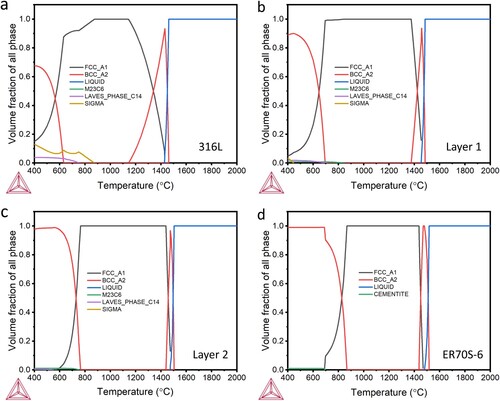
Figure 7. Microhardness profile of the 316L substrate and the first six layers.
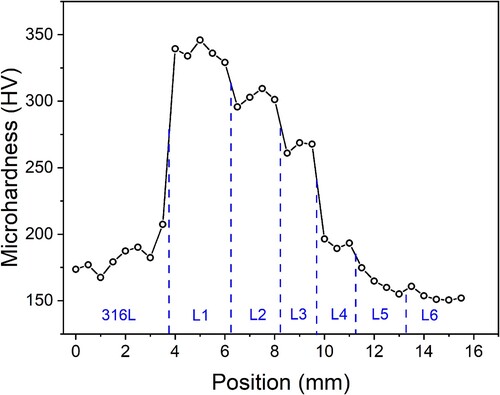
Figure 8. (a) Tensile curves of the 316L/ER70S-6 joint, WAAM-built ER70S-6 in vertical direction, (b) a close-up of tensile curves near their yielding points; (c) A photo showing the tensile sample of the 316L/ER70S-6 bimetal joint before and after the tensile test. Fractography of (d) ER70S-6 and (e) 316L.
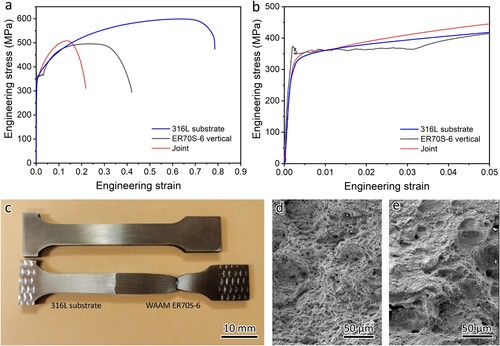
Table 4. Tensile properties of 316L/ER70S-6 joint, WAAM-built ER70S-6 and the 316L substrate.
Figure 9. DIC study showing the colour map of the localised deformation of 316L/ER70S-6 bimetal joint during the tensile test.
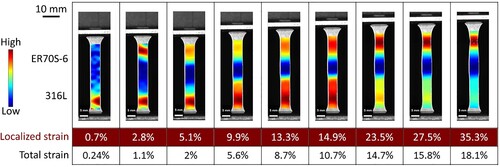
Figure 10. Tensile curves of 316L/ER70S-6 bimetal with the strain measurement from different parts of the tensile sample, (a) from the whole sample, (b) only from the 316L side.
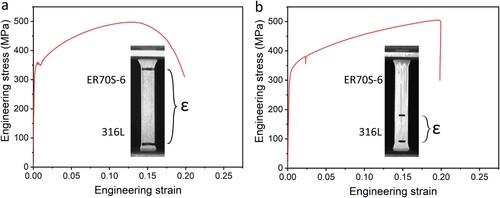
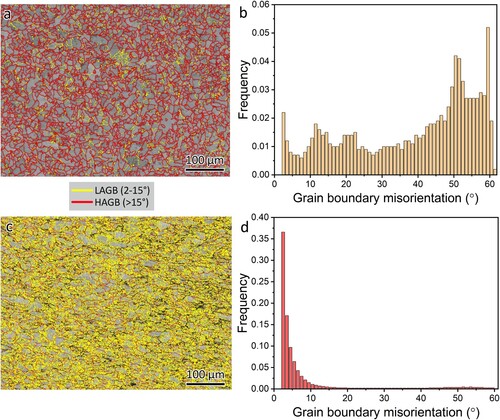
Figure 11. Microstructure evolution of the 316L side of the bimetal joint, (a) EBSD grain boundary map and (b) grain boundary misorientation distribution of the as-received 316L, (c) EBSD grain boundary map and (d) grain boundary misorientation distribution of the 316L after the tensile test.
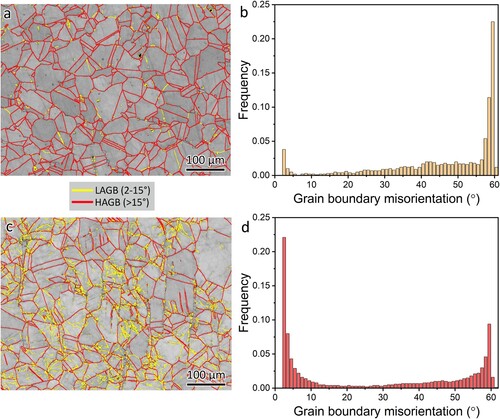
Figure 12. EBSD study of the 316L substrate after fracture, (a) orientation map and (b) distribution of deformation twin boundaries. TB: twin boundary.
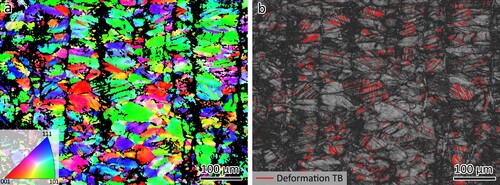
Figure 13. Microstructure evolution of the WAAM-fabricated ER70S-6 side of the bimetal joint, (a) EBSD grain boundary map and (b) grain boundary misorientation distribution of the ER70S-6, (c) EBSD grain boundary map and (d) grain boundary misorientation distribution of the ER70S-6 after fracture.
Data availability statement
The data that support the findings of this study are available on request from the corresponding author.