Figures & data
Figure 1. Thermodynamic prediction results of Ti64 – CoCrFeNiMn alloys: (a) solidification temperature range of Ti6Al4V – CoCrFeNiMn alloys under non-equilibrium process.
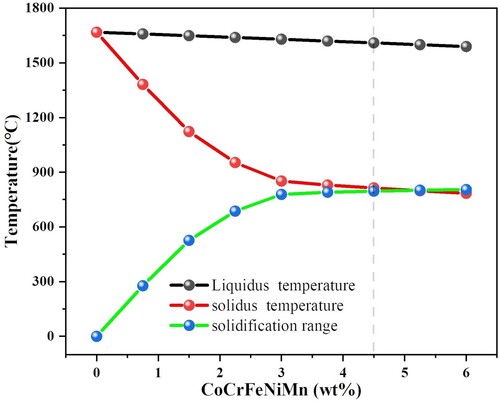
Figure 2. (a) SEM images of the Ti64-(4.5%) CoCrFeNiMn powder and (b) corresponding EDS mappings. (c) Bulk specimens and tensile specimens; (d) dimensions of tensile specimens processed by L-PBF, (e) density of printed samples.
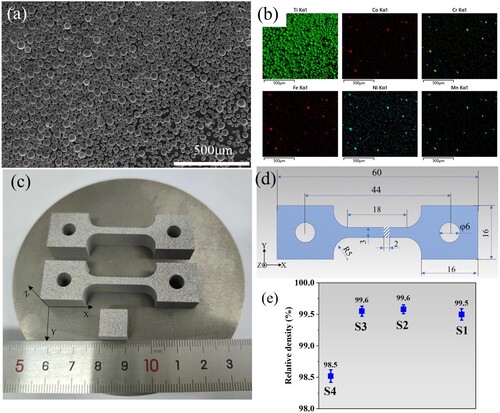
Table 1. Detailed L-PBF processing parameters for the in-situ alloyed Ti64-CoCrFeNiMn samples.
Figure 3. (a)XRD patterns after laser printing in four specimens. (b) Rietveld refinement XRD patterns of Ti64-(4.5%) CoCrFeNiMn samples at different VED.
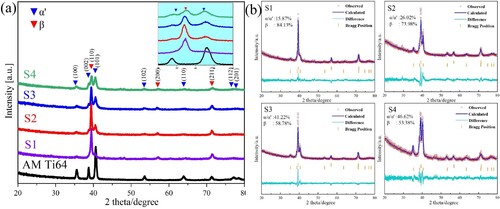
Figure 4. (a) BSE images of the as-printed S3, (b) and (c) corresponding EDS results, (d)enlarged view of the as-printed S3 showing the lava-like heterogeneous microstructure with the coexistence of acicular martensite (yellow arrows), β grains (blue arrows), (e) EDS determined elemental distribution.
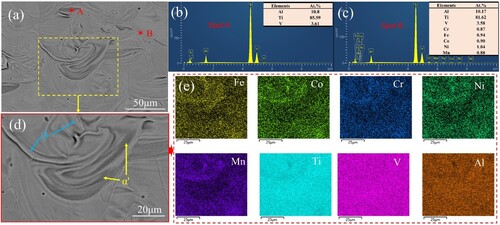
Figure 5. Microstructures of the cross-sections of specimens printed with different laser parameters. (a-d) BSE micrographs showing different features after etching with Kroll’s reagent. (e) The Ti64 structure has coarse columnar crystals and needle like structures α′.
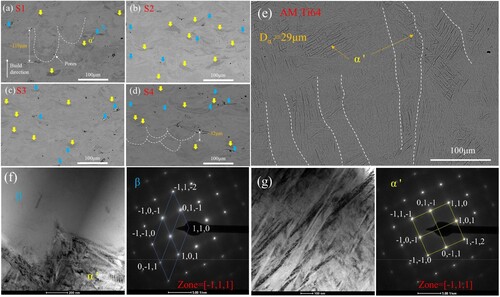
Figure 6. EBSD characterisation of theTi64 + CoCrFeNiMn alloy with different laser parameters on the longitudinal section parallel to Z direction: (a-d) IPF map, Phase map (β is in green and α’ is in red) and corresponding (100), (110) and (111) PFs.
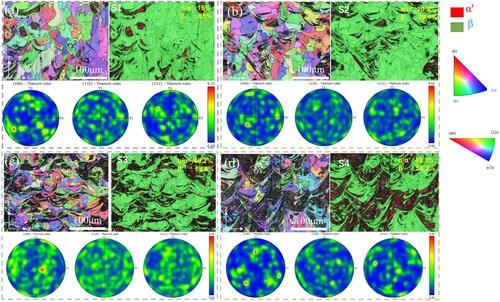
Figure 7. (a) Tensile engineering stress – strain curves of as-built specimens printed with different laser parameters, Ti64 was prepared using the same parameters as S2. (b) comparison of the ultimate tensile strength, yield strength and total elongation of different specimens, (c) Work-hardening rate curves, (d) Engineering tensile strength versus uniform elongation of the as-printed Ti64-CoCrFeNiMn alloy as compared with Ti64 alloy produced by different AM methods and conventional technologies: L-PBFed Ti64 [Citation4,Citation10,Citation30–40]; E-PBF Ti64 [Citation30,Citation36–38]; As-casted Ti64 [Citation31,Citation35]; wrought Ti64 [Citation31,Citation34,Citation35,Citation41]; L-PBFed Ti64-(4.5wt.%)316[Citation10]; Ti64-Nb [Citation42]; Ti64-10Mo [Citation43]; Ti5553[Citation44]; Ti64-CoCrNi [Citation44]; Ti64-Fe2O3 [Citation29].
![Figure 7. (a) Tensile engineering stress – strain curves of as-built specimens printed with different laser parameters, Ti64 was prepared using the same parameters as S2. (b) comparison of the ultimate tensile strength, yield strength and total elongation of different specimens, (c) Work-hardening rate curves, (d) Engineering tensile strength versus uniform elongation of the as-printed Ti64-CoCrFeNiMn alloy as compared with Ti64 alloy produced by different AM methods and conventional technologies: L-PBFed Ti64 [Citation4,Citation10,Citation30–40]; E-PBF Ti64 [Citation30,Citation36–38]; As-casted Ti64 [Citation31,Citation35]; wrought Ti64 [Citation31,Citation34,Citation35,Citation41]; L-PBFed Ti64-(4.5wt.%)316[Citation10]; Ti64-Nb [Citation42]; Ti64-10Mo [Citation43]; Ti5553[Citation44]; Ti64-CoCrNi [Citation44]; Ti64-Fe2O3 [Citation29].](/cms/asset/52148d47-9033-4203-9cd8-86546d4ce3b2/nvpp_a_2375106_f0007_oc.jpg)
Table 2. Mechanical properties of the as-printed Ti64-(4.5%) CoCrFeNiMn alloy at different VED.
Figure 8. Typical SEM fractography under different magnifications of the fractured:(a) S1, (b) S2, (c) S3, (d) S4 stretched at room temperature.
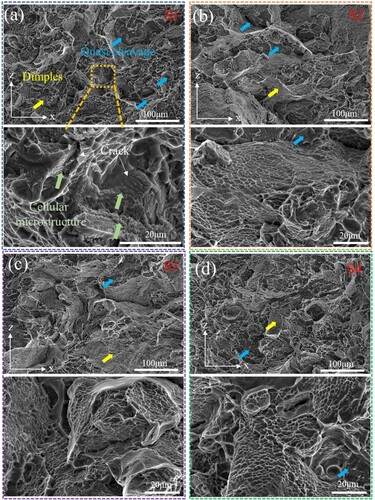
Figure 9. (a,) The cellular oversaturated β phase and its mesh-like structure in the S1, (b) The magnified view of the cellular structure and its elemental distribution., (c) crack initiation and propagation under stress state of as-printed S1 sample.
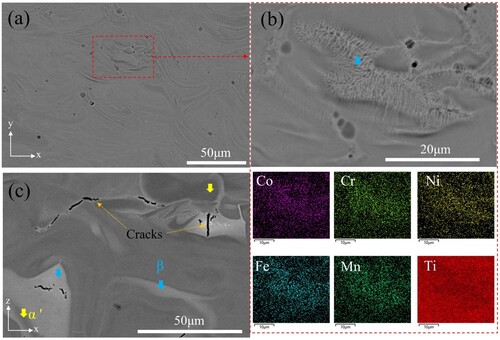
Table 3. Measured local compositions (wt.%) of the as-printed Ti64-(4.5%) CoCrFeNiMn alloy at different VED.
Figure 10. (a-d) Cross-sectional microstructures of samples printed with different laser parameters and EDS maps showing the distribution of Mn element. The rectangular boxes in the images display the overall HEA element content in those regions.
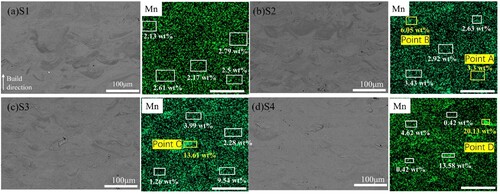
Table 4. Crucial physical quantities for material structural stability.
Figure 11. (a) Hysteresis loops of unload-reload tests for printed titanium alloy and the evolution of (b) HDI stress values. (c) Nanohardness mapping in the S3 specimen; (d) Corresponding load-displacement curves at selected positions during nanoindentation tests.
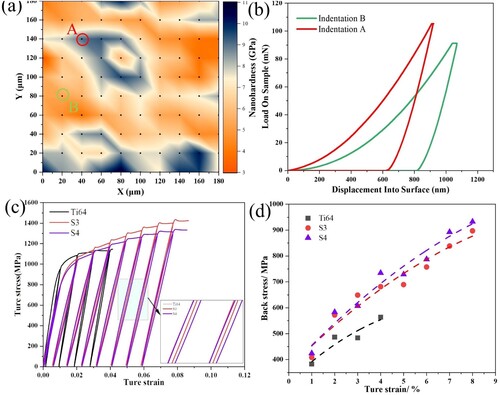
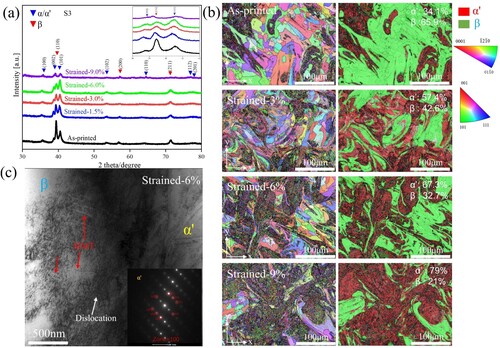
Figure 12. (a) XRD profiles and (b) EBSD analysis of the S3 alloy in as-printed state illustrate the continuous transformation of the β phase to the a′ phase during a tensile test. (c) SIMT was found in the stress concentration area at a strain of 6%.