
Figures & data
Figure 1. Solidification paths of (a) AA6061 alloy, (b) Al-Mg-Si-Ti alloy calculated using the Scheil-Gulliver model, and (c) enlarged image of (a) and (b) for the final stage of solidification.
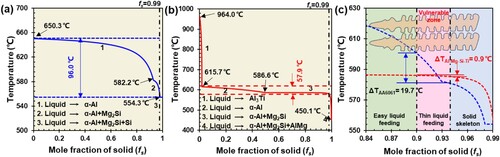
Figure 2. (a) Solidification interval maps calculated using the Scheil-Gulliver model, (b) crack susceptibility index (CSI) maps, and (c) growth restriction factor (Q) maps in the Al-Mg-Si alloy.
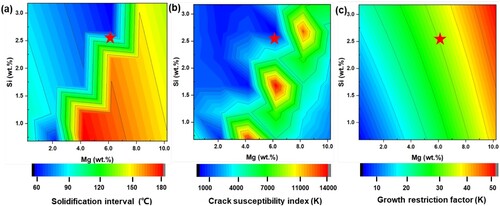
Figure 3. Characterisation of pre-alloyed powders including powder particle morphology, particle size distribution and EDS mapping, (a, b) AA6061, (c, d) Al-Mg-Si-Ti, (e) schematic of the scanning strategy during L-PBF, (f) the cubic, cuboid samples; and the detailed dimension of dog-bone-shaped tensile samples.
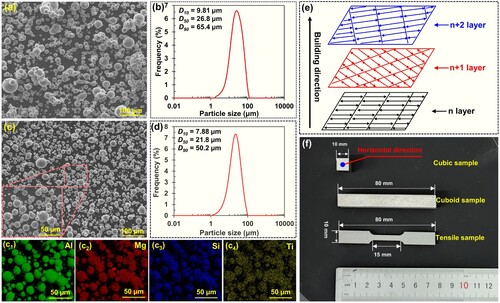
Table 1. Chemical compositions of the AA6061 and the Al-Mg-Si-Ti alloy measured by ICP-AES (wt.%).
Figure 4. OM images of (a) the AA6061 and (e) the Al-Mg-Si-Ti alloys taken from the XY, YZ and XZ planes; EBSD-IPF maps, grain size distribution, pole figures and KAM image along the build direction: (b-d) the AA6061 alloy; (f-h) the Al-Mg-Si-Ti alloy; Typical solidification microstructure of (i-k) the AA6061 alloy, (l-n) the Al-Mg-Si-Ti alloy.
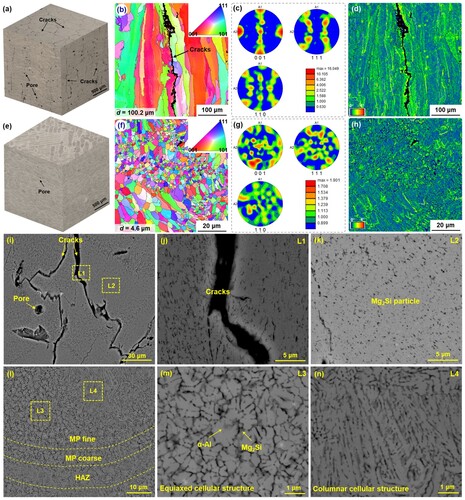
Figure 5. (a) HAADF-STEM image of L-PBFed Al-Mg-Si-Ti alloy and (a1-a4) EDS maps of Al, Mg, Si, and Ti elements; (b) the interaction between the dislocations in Mg2Si eutectics; (c) BF-TEM micrographs of α-Al matrix containing Al3Ti particles; (c2) SAED pattern of L12-Al3Ti; (c3,c4,d) EDS mapping corresponding the (c1); (e1, e2) IFFT patterns of α-Al matrix and Mg2Si selected in (a); (f) HR-TEM of the α-Al/ L12-Al3Ti interface and (f1, f2) IFFT patterns of the α-Al and L12-Al3Ti selected in (f); (g) IFFT image of the interface marked by the blue dashed line in (f). Note: the region characterised by TEM is located in the centre of the melt pool.
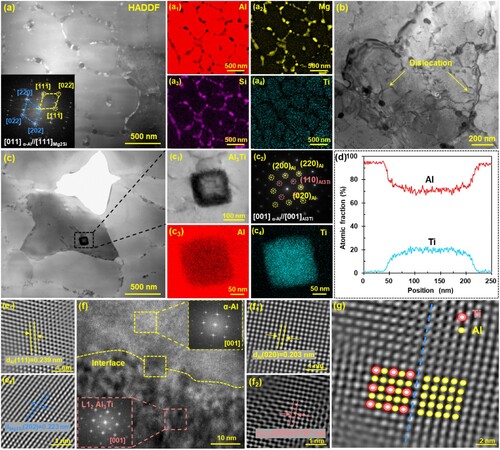
Figure 6. (a) Engineering stress-strain curves of L-PBFed AA6061 and Al-Mg-Si-Ti alloys; (b) a comparison of mechanical properties with the conventionally manufactured AA6601 (cast and wrought), L-PBFed AA6061 with heated build plate, AA6061 + Zr/Sc and Al-Si-Mg; (c, d) fracture morphology of the L-PBFed AA6061 alloy; (e, f) fracture morphology of the L-PBFed Al-Mg-Si-Ti alloy.
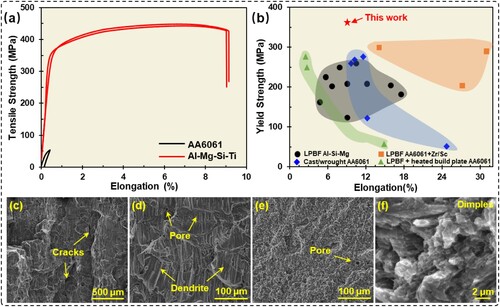
Table 2. Mechanical properties of the L-PBFed AA6061 and Al-Mg-Si-Ti alloys.
Figure 7. (a) Schematic of the columnar grains and cracks in the L-PBF AA6061 alloy; (b) Schematic of the synergistic grain-refining mechanisms including heterogenous nucleation and growth restriction effects in the L-PBF Al-Mg-Si-Ti alloy; (c) Calculated critical hot cracking stress in the AA6061 and Al-Mg-Si-Ti alloy at the final stage of solidification.
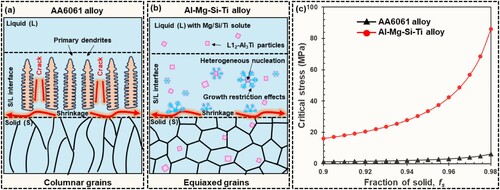
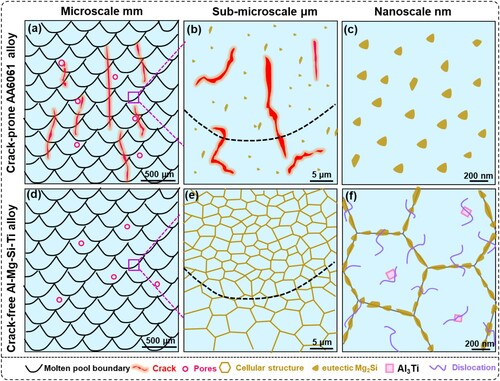
Figure 8. Schematic diagram of the microstructure evolution during solidification: (a-c) AA6061 alloy; (d-f) Al-Mg-Si-Ti alloy.
Supplemental Material
Download MS Word (141.5 KB)Data availability statement
Data will be made available on request.