
Figures & data
Figure 1. Research framework for this study.
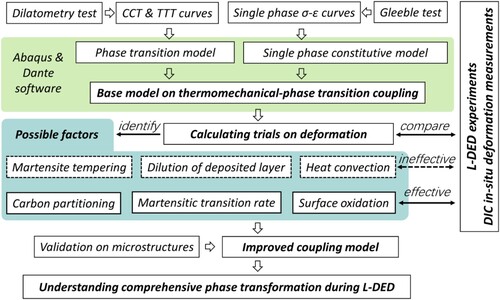
Figure 2. Powder-based L-DED system configuration.
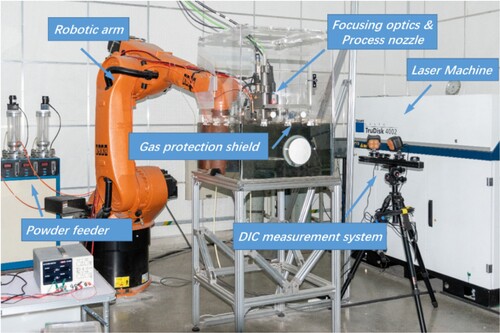
Table 1. Elemental composition of 4140 and T15 materials (wt%).
Table 2. Optimal operating parameters for multilayer L-DED of T15 steel.
Figure 3. In situ measurement experiments of substrate deformation.
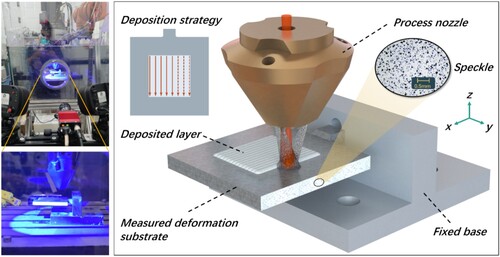
Figure 4. Data quality evaluation and depositional deformation analysis of DIC in-situ monitoring. (a) Measuring error evaluation; (b) Displacement field and location of sampling point P0.
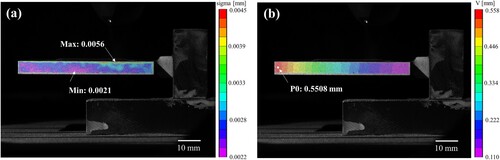
Figure 5. In-situ measured displacement curve of sampling point P0 in the substrate.
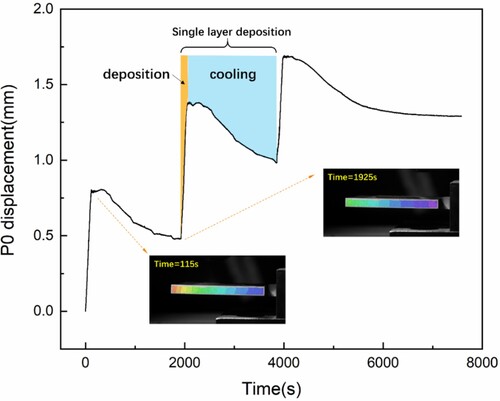
Figure 6. Experimental substrate deformation values and trends under intermittent thermal cycling.
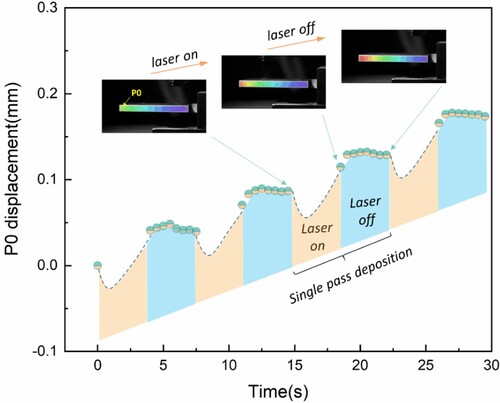
Figure 7. Schematic of substrate deformation during a single thermal cycle.
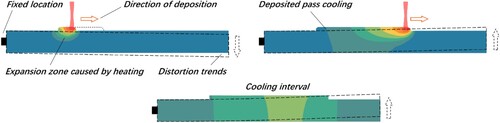
Figure 8. Geometry and mechanical boundary conditions of the model computational domain (unit: mm).
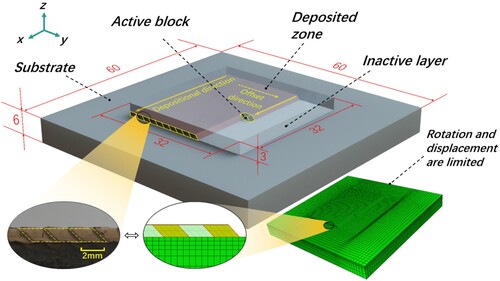
Figure 9. Energy distribution curve of measured laser.
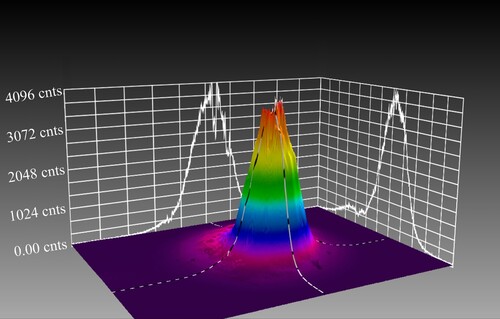
Figure 10. Experimental results of isothermal transition of deposited material.
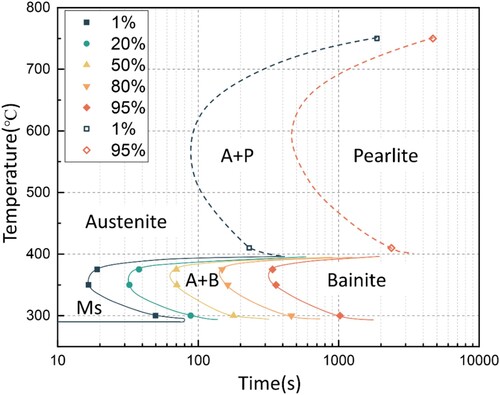
Figure 11. Displacement curve obtained using basic phase transformation model.
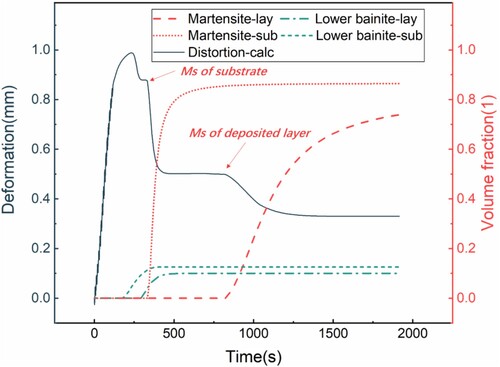
Figure 12. Comparison of thermomechanical model and phase transformation coupling model with DIC results.
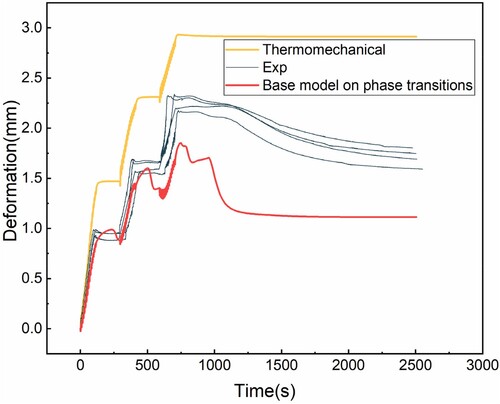
Figure 13. Precipitate and carbides in the deposited layers.
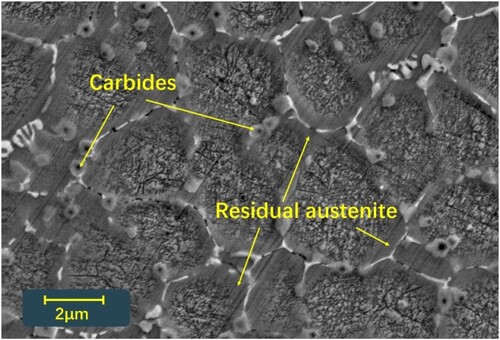
Figure 14. EPMA mapping analysis of the deposited layers.
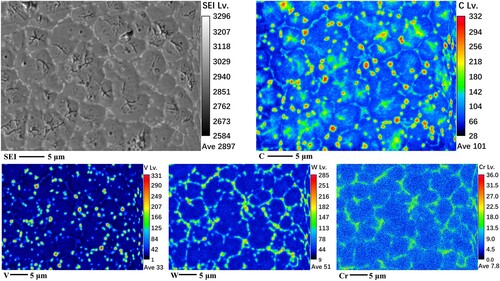
Figure 15. XRD analysis results of the deposited layers.
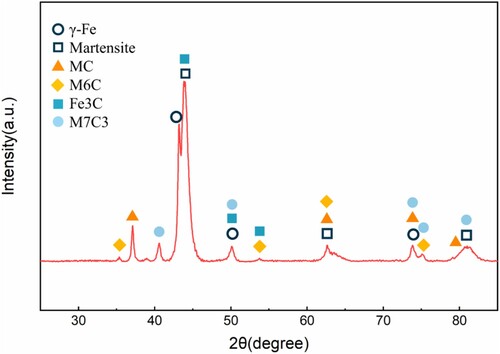
Figure 16. Dilatometry with its derivative curves for different holding temperatures.
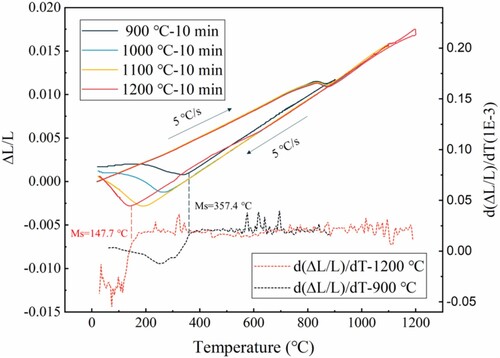
Figure 17. Prediction deformation considering the effect of carbide precipitation. (a) Single-layer deposition deformation and phase content. (b) Multilayer deposition deformation.
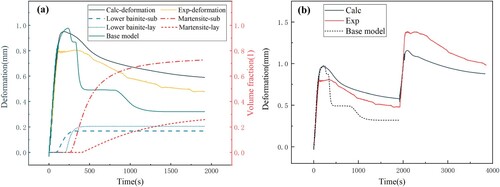
Figure 18. Location and results of XPS measurements of the deposited surface.
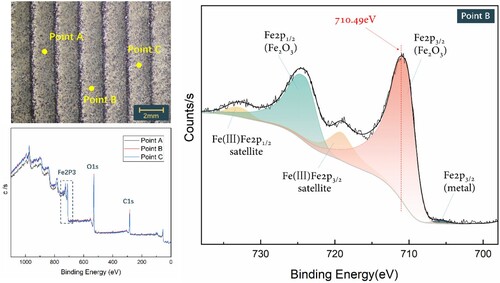
Figure 19. Deformation curve at P0 calculated by the model considering oxidation.
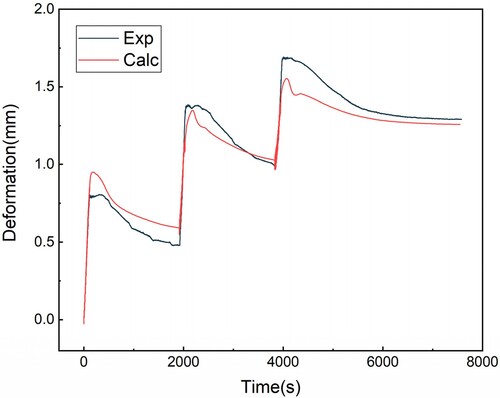
Figure 20. Martensite transformation behaviour during deposition and cooling processes. (a) Martensite transformation behaviour of the substrate; (b) Martensite transformation behaviour of the deposited layer.
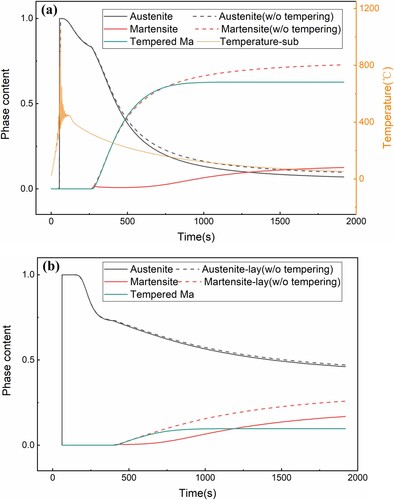
Figure 21. Calculation of multilayer deposition deformation considering martensitic tempering.
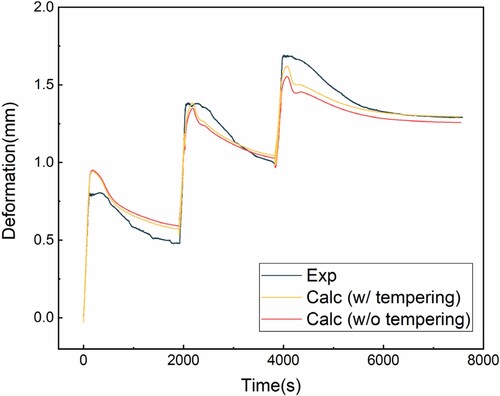
Figure 22. Comparison of deformation calculation between thermomechanical model and phase transformation coupling model.
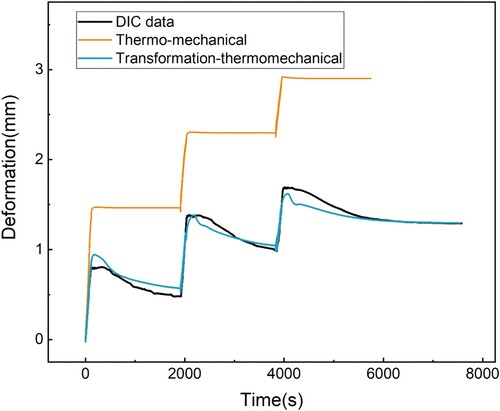
Figure 23. Comparison of residual austenite distribution calculated from the phase transformation coupling model and XRD results. (a) Simulated residual austenite distribution; (b) Variation of austenite peak intensity measured by XRD.
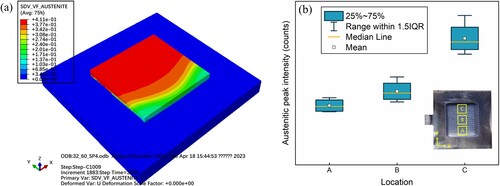
Figure 24. EBSD image of the second pass of the second layer deposited.
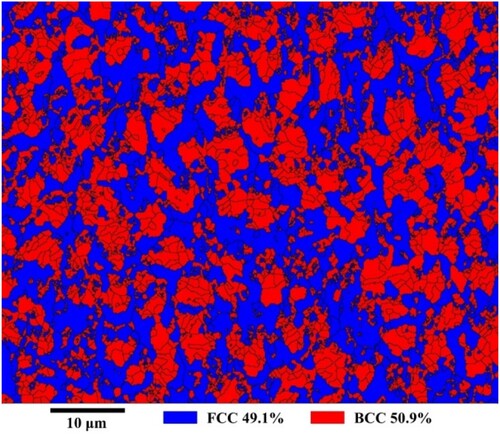
Figure 25. Comparison of lower bainite distribution between the prediction and experiments.
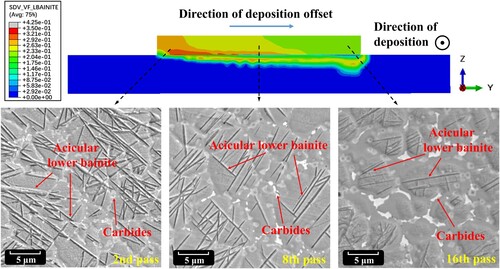
Figure 26. Temperature variation curves at the centre section of the 2nd, 8th and 16th passes of the second layer deposition process.
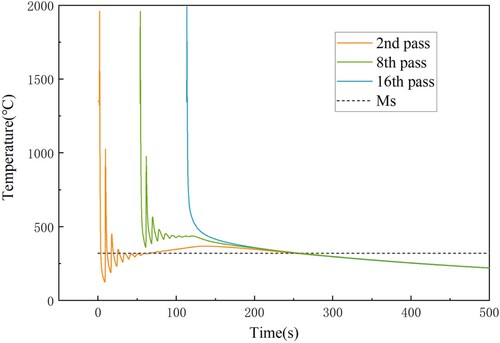
Figure 27. Comparison of martensite distribution between the prediction and experiments.
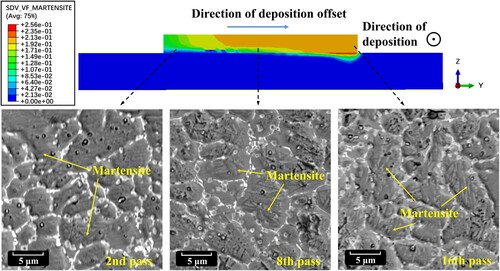
Figure 28. Electron diffraction pattern of the martensitic characterization site.
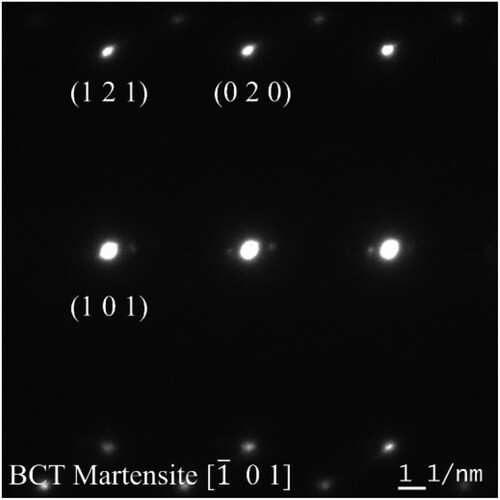
Figure 29. Phase transformation at different moments of the L-DED and its effect on deformation.
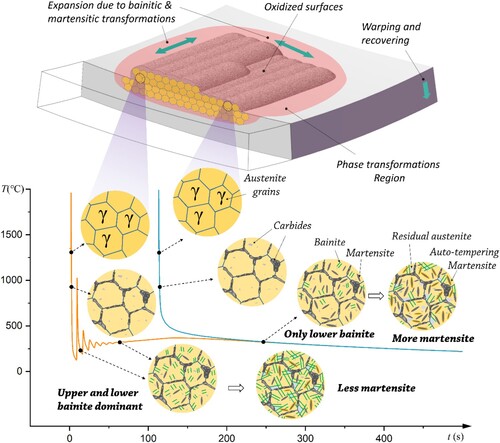
Figure A1. Variation curve of thermophysical parameters of substrate and deposited material.
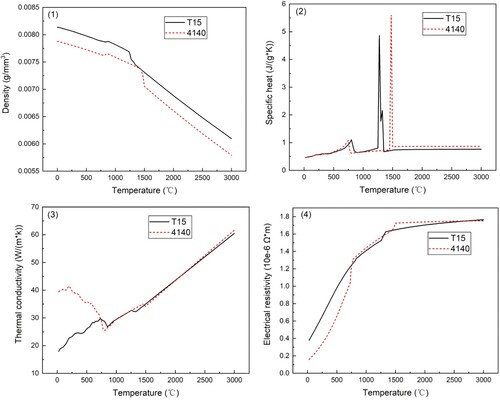
Figure A2. Schematic of temperature variation in continuous cooling experiment.
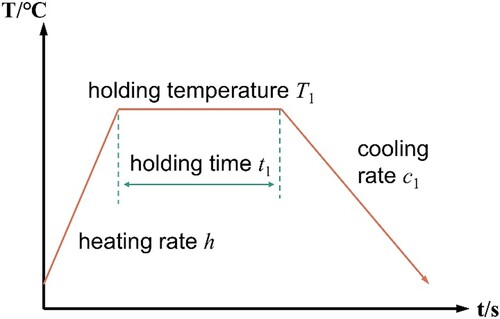
Table A1. Parameter settings for continuous cooling experiments.
Figure A3. Dilatometry curves at different cooling rates.
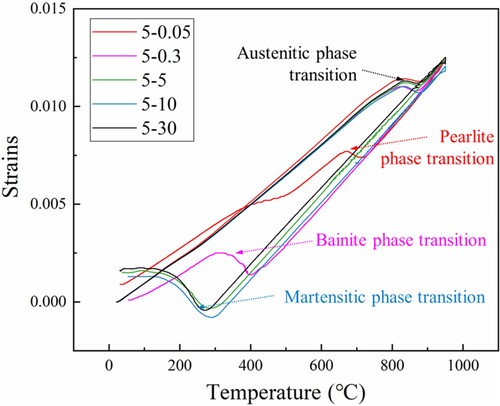
Table A2. Kinetic parameters of the phase transformation of T15 in the base model.
Table A3. Kinetic parameters of phase transformation of AISI 41XX at different carbon contents.
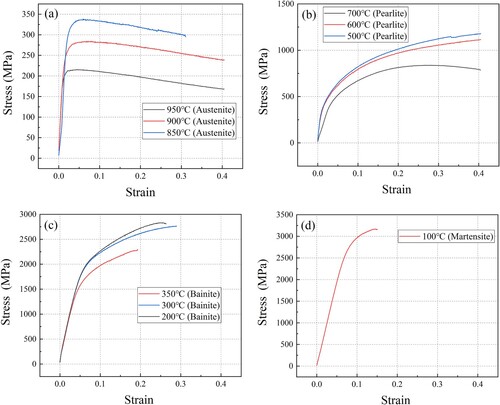
Figure A4. Stress-strain curves of single phase T15 HSS at different temperatures. (a) Temperature 950°C−850°C (Austenite); (b) Temperature 700°C−500°C (Pearlite); (c) Temperature 400°C−300°C (Bainite); (d) Temperature 100°C (Martensite).
Data availability statement
The data that support the findings of this study are available from the corresponding author upon reasonable request.