
Figures & data
Figure 1. An overview of the proposed workflow.
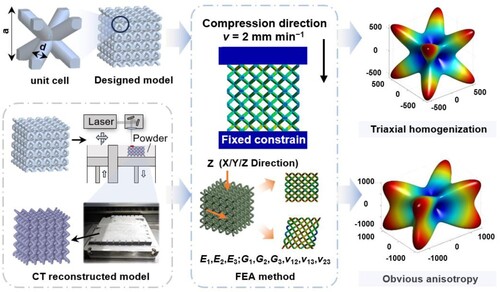
Figure 2. (a) Geometrical parameters of the unit cell and complete lattice structure model of the test sample, (b) scanning strategies, (c) diagram of laser powder bed fusion (LPBF) process and (d) morphologies of the AlSi10Mg powder.
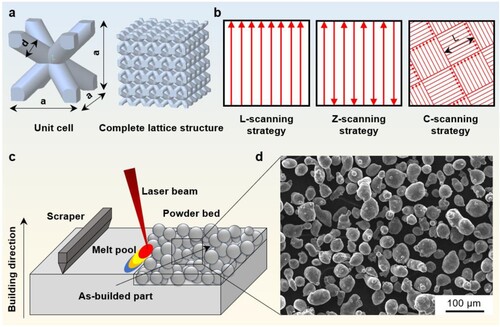
Table 1. Chemical composition of AlSi10Mg powder.
Table 2. Factors and levels of present OED.
Table 3. Results of ANOVA due to obtained MFPS.
Figure 3. The designed models, LPBF-processed samples and CT reconstructed models of four lattice structures with different strut diameters.
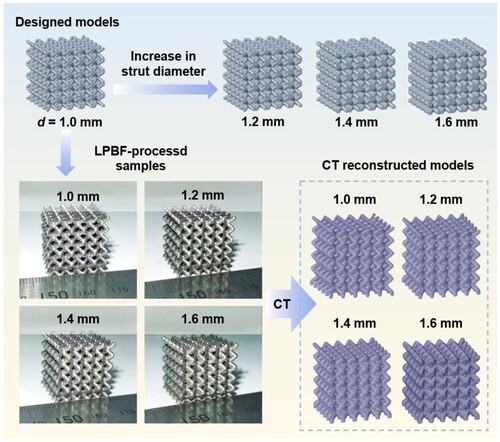
Figure 4. Manufacturing accuracy of lattice structures with different strut diameters: (a) material relative density, (b) volumetric error and (c, d) the morphology of the struts and the characteristics of slag hanging on the suspension surface with d = 1.0 and 1.6 mm.
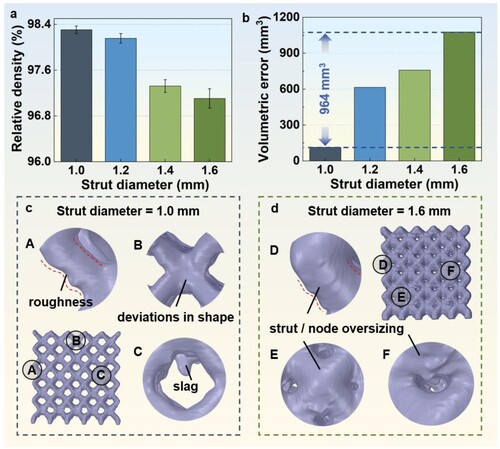
Figure 5. Compression mechanical properties of LPBF-processed lattice structures with different strut diameters: (a) stress–strain curves, (b) elastic modulus, (c) energy absorption and (d) specific energy absorption.
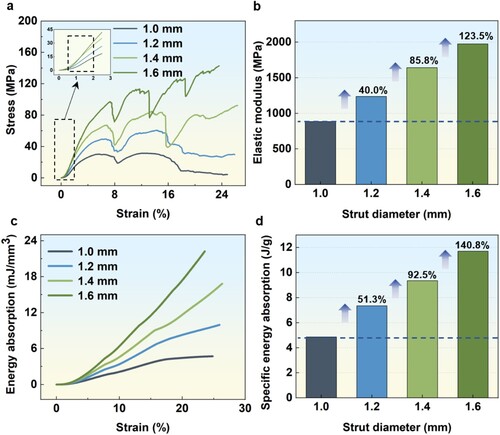
Table 4. The mechanical properties of LPBF-processed lattice structures with different strut diameters.
Figure 6. Comparison of compressive response curve between experimental and FEA result with different strut diameters: (a) d = 1.0 mm, (b) d = 1.2 mm, (c) d = 1.4 mm and (d) d = 1.6 mm.
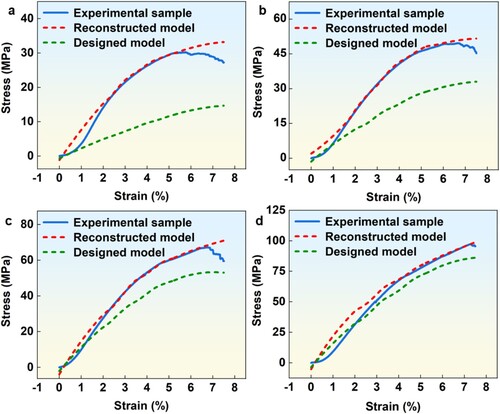
Figure 7. Comparison of mechanical properties: (a) elastic modulus (E) and (b) maximum first peak stress (MFPS).
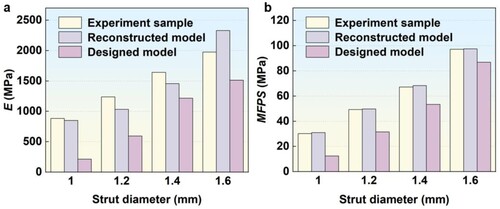
Figure 8. Comparison between the stress distribution and the deformation behaviour of experiment samples.
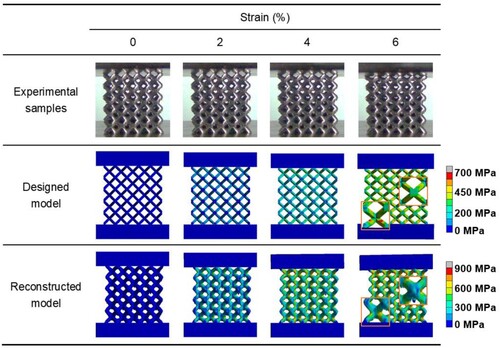
Figure 9. Equivalent elastic matrix of lattice structures based on homogenisation theory: (a) triaxial compression FEA result, (b) Poisson's ratio in three directions, (c) triaxial shear FEA result and (d) equivalent elastic matrix of lattice structures (d = 1.0 mm).
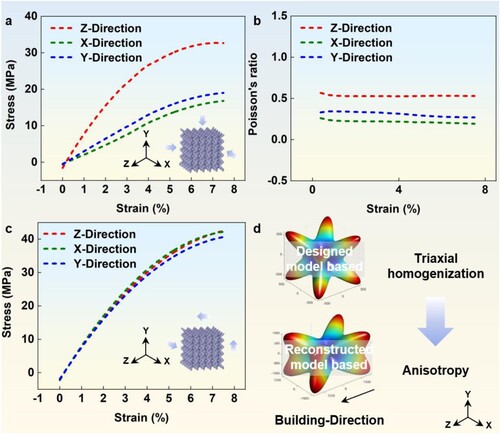
Figure 10. Effective elastic modulus of lattices under different strut diameters: (a) d = 1.0 mm, (b) d = 1.2 mm, (c) d = 1.4 mm and (d) d = 1.6 mm.
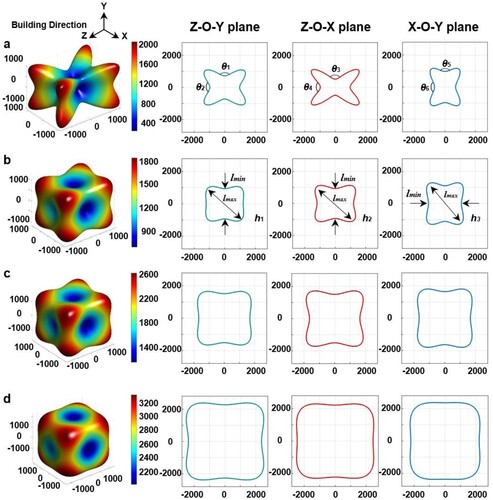
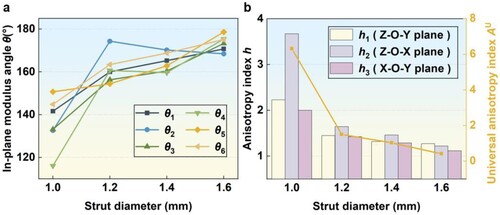
Figure 11. Anisotropy analysis of lattices under different strut diameters: (a) the angles between the in-plane Young's modulus and (b) the anisotropy level of the lattice.
Data availability statement
The data that support the findings of this study are available from the corresponding author upon reasonable request.