
Figures & data
Table 1. Mixing proportion of the robotic spray coating.
Table 2. Material properties of carbon fibre.
Figure 1. Schematic drawing of the latter mixing method
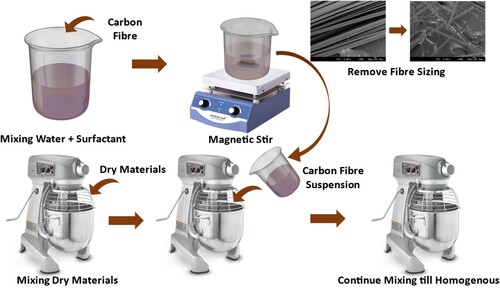
Figure 2. Setup of the robotic spray: (a) spray printing system and (b) details of the spray nozzle.
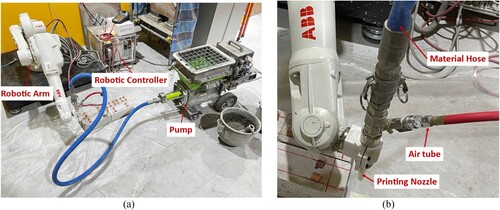
Table 3. Designed parameters and values evaluated for spray printing.
Figure 3. Schematic of robotic spray in 3 directions:(a) vertical, (b) horizontal and (c) overhead.
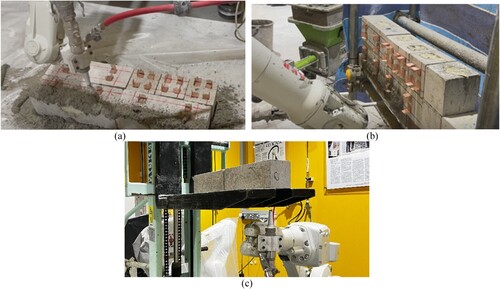
Table 4. Detailed spray application parameters of prepared concrete specimens.
Figure 4. Schematic of compression and 3-point bending tests.
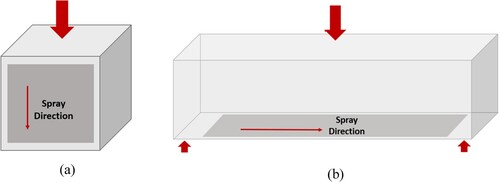
Figure 5. Schematic diagram of split tensile test for bond strength measurement.
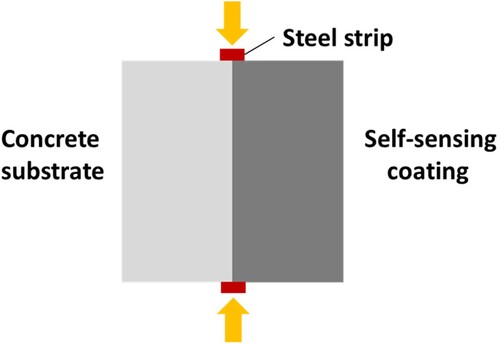
Figure 6. Schematic of Micro-CT scanning and reconstruction of 3D images.
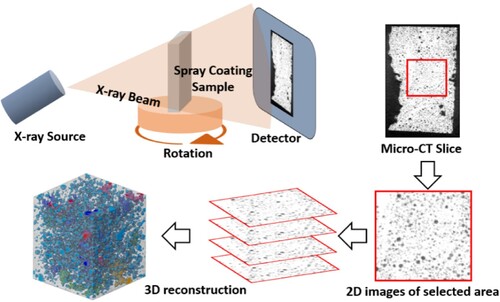
Figure 7. Schematic drawing of 4-electrode Vander Pauw configuration for piezoresistivity measurement.
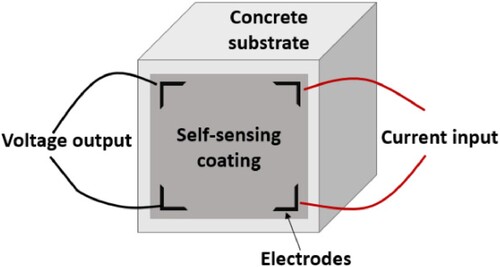
Figure 8. Schematic of electrode configuration of samples under (a) compression and (b) bending with measurement orientation parallel to strain variation.
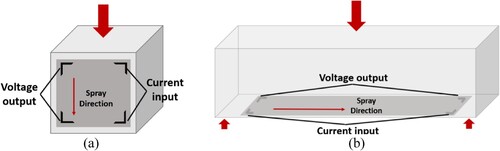
Figure 9. (a) Compressive and (b) Flexural strength of samples with sprayed coating.
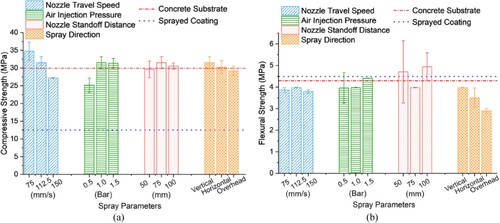
Figure 10. Assessment of correlation between coating adhesion and spray parameter: (a) bonding strength measurements and (b) microscopic images of bonding zones.
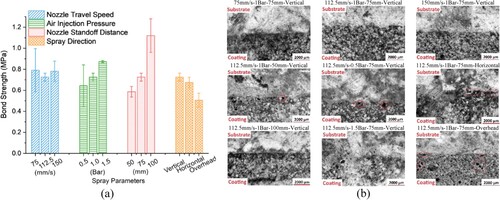
Figure 11. Comparative analysis of spray coating porosity across different spray parameters.
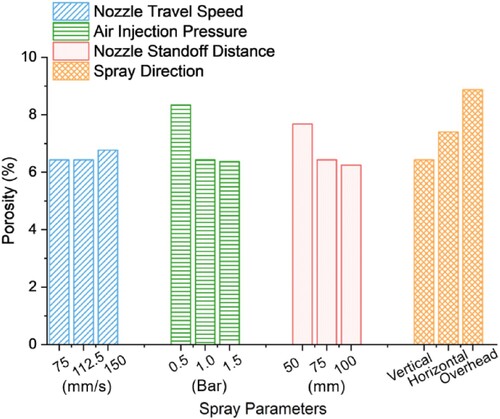
Figure 12. Pore size distribution of the sprayed coating with nozzle travel speed of (a) 75 mm/s, (b) 112.5 mm/s and (c) 150 mm/s.
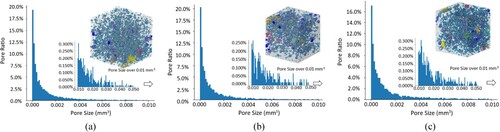
Figure 13. Pore size distribution of the sprayed coating with air injection pressure of (a) 0.5 Bar, (b) 1 Bar and (c) 1.5 Bar.
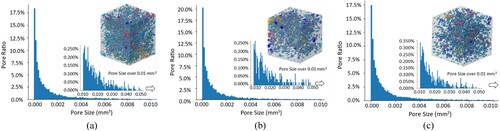
Figure 14. Pore size distribution of the sprayed coating with nozzle standoff distance of (a) 50 mm, (b) 75 mm and (c) 100 mm.
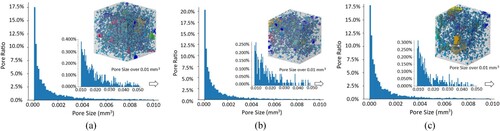
Figure 15. Pore size distribution of the sprayed coating with (a) vertical, (b) horizontal and (c) overhead spray.
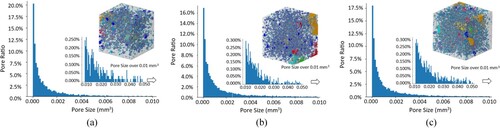
Figure 16. Piezoresistive response of self-sensing coating under (a) cyclic compression and (b) cyclic bending.
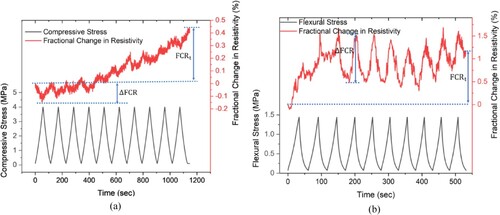
Figure 17. piezoresistive performance of the coating subjected to (a) cyclic compression and (b) cyclic bending.
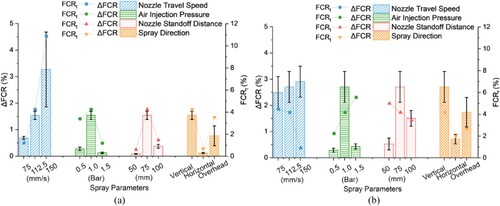
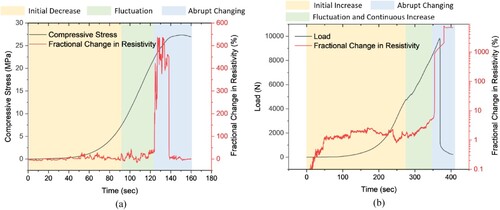
Figure 18. Fractional change in resistivity in coated specimens when subjected to (a) compressive and (b) flexural load to failure.
Data availability
The raw/processed data of this study are available from the corresponding author upon reasonable request.