
Figures & data
Figure 1. Pancreatic cancer illustrations that vary in the degree of detail.
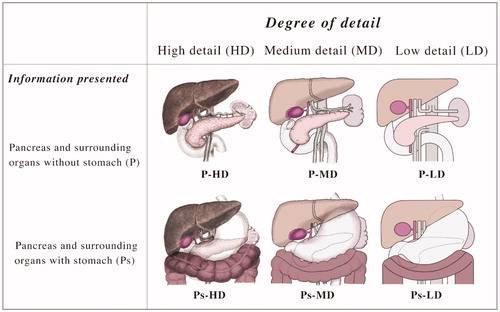
Figure 2. Uterine cervical cancer illustrations that vary in the degree of detail.
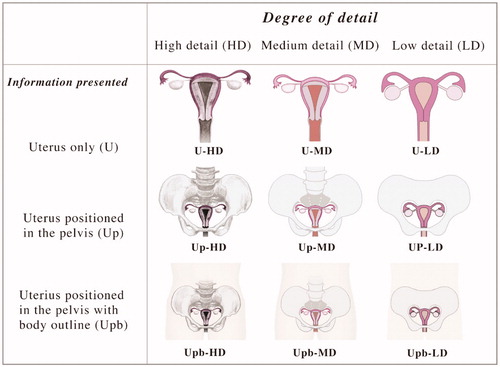
Table 1. Participant details and perceived knowledge of the cancers (N = 420)
Table 2. Pancreatic cancer: evaluated most preferable, least preferable, and comprehensible for all illustrations.
Table 3. Cervical cancer: evaluated most preferable, least preferable, and comprehensible for all illustrations.
Table 4. Pancreatic cancer: evaluated most preferable, least preferable, and comprehensible for all detail degrees.
Table 5. Cervical cancer: evaluated most preferable, least preferable, and comprehensible for all detail degrees.
Table 6. Pancreatic cancer: cross-tabulation comparing the relationships between gender and illustrations’ degrees of detail.
Table 7. Cervical cancer: cross-tabulation comparing the relationships between gender and illustrations’ degrees of detail.
Table 8. Pancreatic cancer: cross-tabulation comparing the relationships between two age ranges and illustrations’ degrees of detail.
Table 9. Cervical cancer: cross-tabulation comparing the relationships between two age ranges and illustrations’ degree of detail.
Data availability statement
The datasets generated and/or analysed during this study are not publicly available, as they include personal data; however, they are available from the corresponding author on reasonable request.