
Figures & data
Figure 1. Three zones of the posterior cervical triangle.
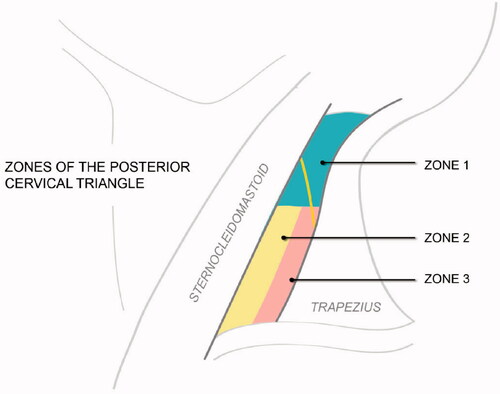
Figure 2. 2D Guideline image. Top: Blue highlights mark areas in question. Bottom: Process work after second round of revisions.
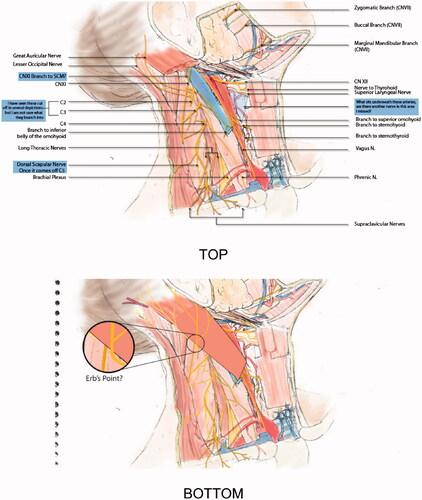
Figure 3. Cylinders morphed, scaled and sculpted into neck muscles shapes.
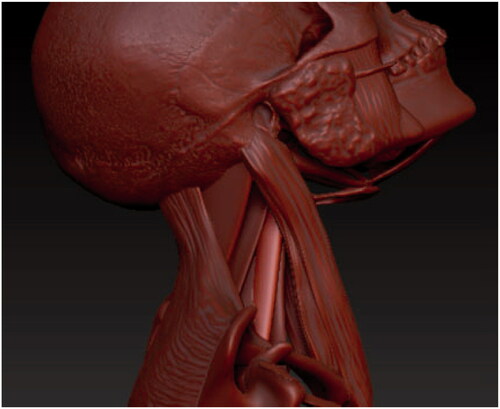
Figure 4. Alphas used to create texture and colouration.
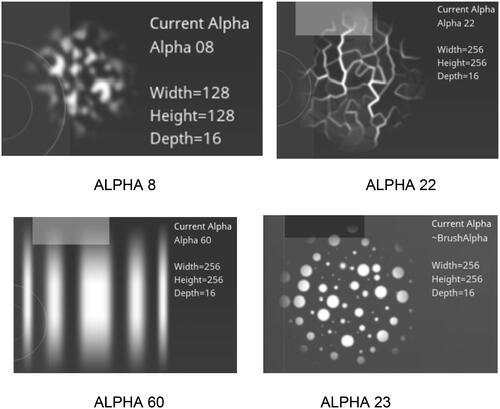
Figure 5. ZSpheres forming the nerves, veins, and arteries.
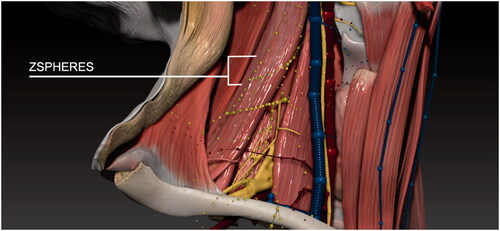
Figure 6. Transparent SCM on left side of model.
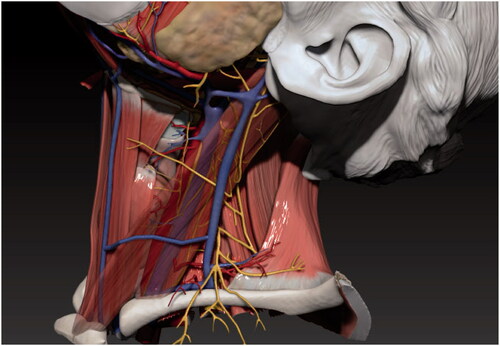
Figure 7. Muscle and skull colouration in progress.
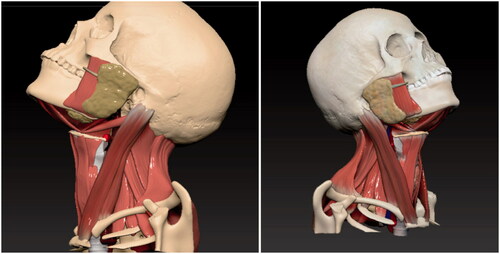
Figure 8. Progression of greyscale variation of model.
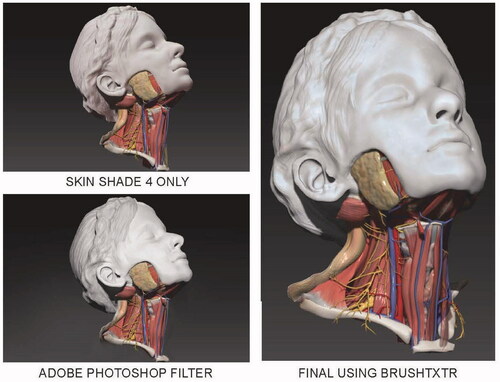
Figure 9. Finalised muscles after being refined multiple times.
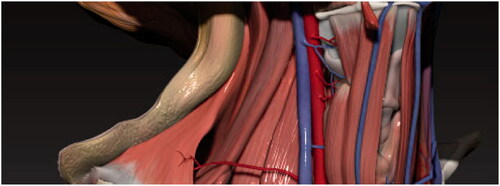
Figure 10. Thematic analysis: themes and subthemes.
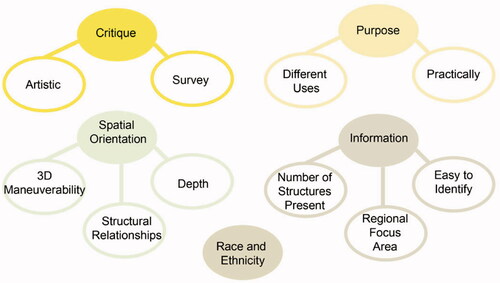
Table 1. Survey participant background.
Table 2. Survey Section 1: Questions and results (Images 1 and 2: (Berger, Citation2020); Image 4:(Gray, Citation1918, p. 576)
Table 3. Survey Section 1: Differences between groups (Question 4), difference in responses to Question 4, by participants from an Artistic Background and a Medical/Anatomical Background
Table 4. Survey Section 2: Questions and results.
Table 5. Survey Section 2: Differences between groups (Questions 9, 10, 11). Difference in responses to Question 9, 10, 11 by participants from an Artistic Background and a Medical/Anatomical Background
Table 6. Section 3 questions and results.
Table 7. Survey Section 2: Differences between groups (Question 18)