Figures & data
Figure 1. Schematic diagram of sequential enzymatic digestion method.(A) Intact bone-periosteum complex was first treated with 0.2% trypsin for 30 min.(B) The majority of fibrous layer cells were liberated during the first 2-h collagenase digestion.(C) The remaining cambium layer cells were isolated after the second 2-h collagenase digestion.
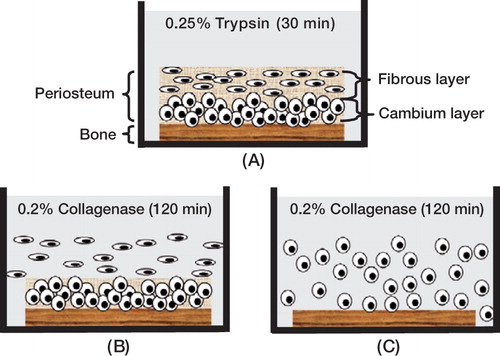
Figure 2. (A) Hematoxylineosin staining of bone-periosteum complex harvested from the proximal tibia of a 6-month-old rabbit (100 ×).(B) Histology of the fibrous layer in the periosteum (400 ×). Spindle-shaped fibroblasts were sparsely distributed in collagen matrix.(C) Histology of the cambium layer in the periosteum (400 ×). Osteoclasts (arrows) were found among dense osteoblast-like cells in the cambium layer.
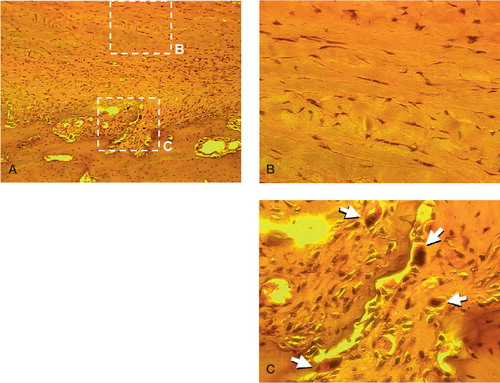
Figure 3. Histology of periosteum-bone complex during the sequential enzymatic digestion method. (A) Periosteumbone complex after 30 min of trypsin digestion. (B) After 2 h of collagenase digestion, only cambium layer cells remained on the cortical bone. (F: fibrous layer; C: cambium layer; B: bone).
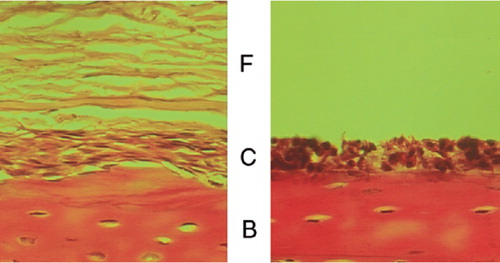
Figure 4. Morphology of the periosteal fibrous layer cells (A:day 3;C:day 6) and cambium layer cells (B: day 3; D: day 6). Magnification 200 ×.
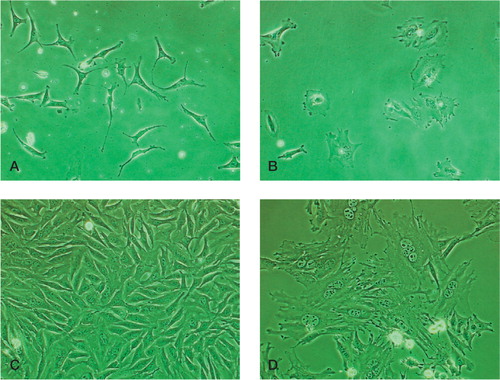
Figure 5. Osteoclast-like multinucleate cells were found in the cell population from the cambium layer (400 ×).
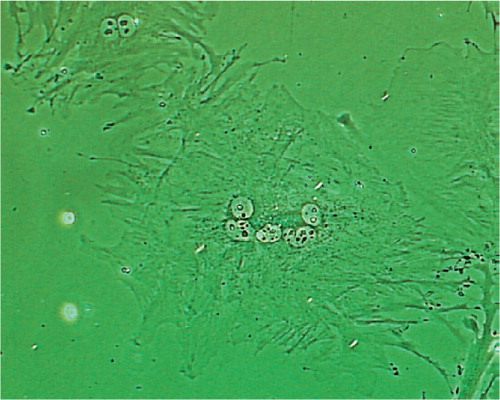
Figure 6. Cell proliferation assay (BrdU).Fibrous layer cells (A:200 ×) and cambium layer cells (B: 400 ×).
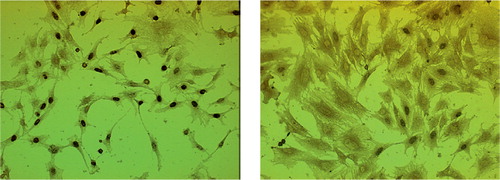
Figure 7. Histology of freshly harvested periosteum stained using alkaline phosphatase histochemical assay, with hematoxylin counterstaining. The cambium layer shows a high level of alkaline phosphatase activity (shown by red color), whereas the fibrous layer shows negligible alkaline phosphatase activity (400 ×).
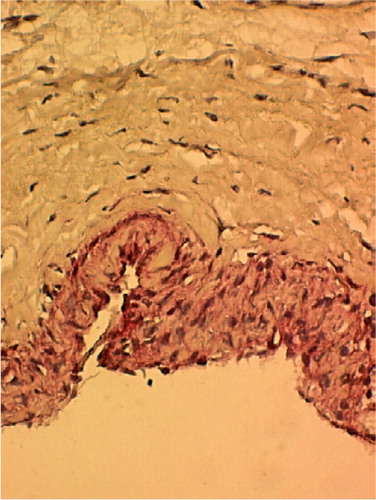
Figure 8. Quantitative alkaline phosphatase activities in fibrous layer cells (○) and lysed cambium layer (□) cells (*p < 0.05)
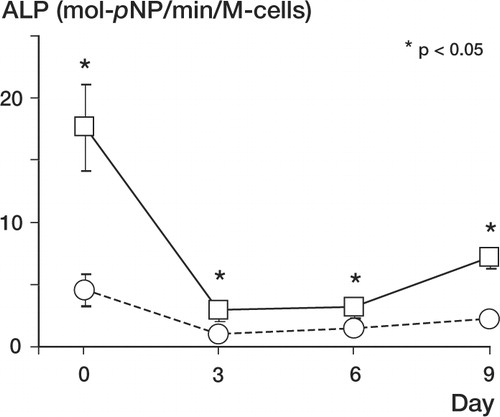
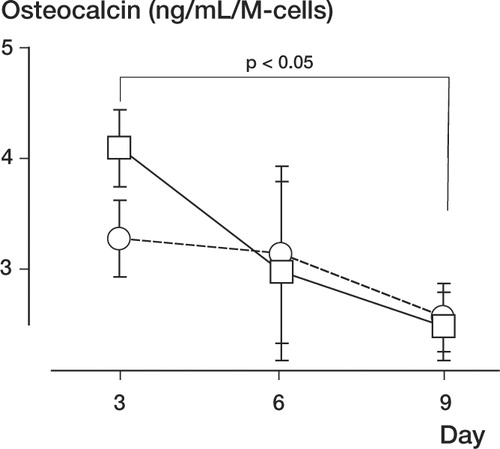
Figure 9. Quantitative osteocalcin production from the fibrous layer (○) and cambium layer (□) cells (*p < 0.05).