Figures & data
Figure 1. Correlation between serum TACP level and volume of tumor in 26 patients with GCT. There was a significant positive correlation (r = 0.52; p = 0.007).
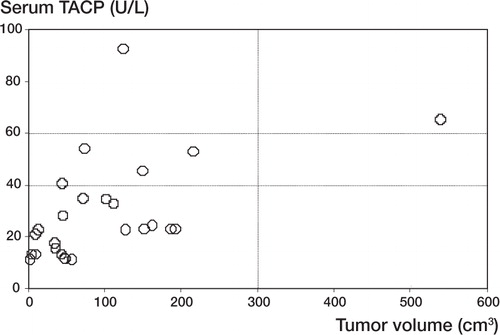
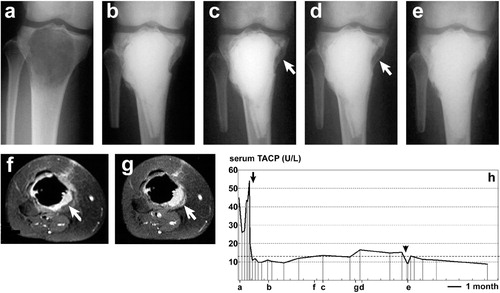
Figure 2. Changes in serum TACP level (panel h) and radiographic images (panels a to g) from one of the GCT patients with local recurrence (a 16-year-old woman). Radiographs of the right tibia with anteroposterior view (a to e) and axial magnetic resonance images of gadolinium-enhanced with fat saturation (TR 400/TE 13) (f, g) were obtained during the pre- and postoperative course. The lower-case letters corresponding to panels a–g represent the time course of examinations shown in the x-axis of the graph (panel h). A continuous decline in TACP level was observed after the first curettage followed by grafting of autologous bone and tricalcium phosphate (black arrow). Re-elevated TACP level accompanying local recurrence was observed and confirmed by radiological imaging (white arrows in panels f, c, g and d). Re-operation with curettage and tricalcium phosphate graft resulted in a reduction of the level to within normal range (black arrow-head).