Figures & data
Figure 1. Dimensioned drawing of the test specimen.
Figure 2. Variation in number of fatigue cycles (Nf) with the amount of gentamicin sulfate added to the cement powder. (Mean, 95% CI).
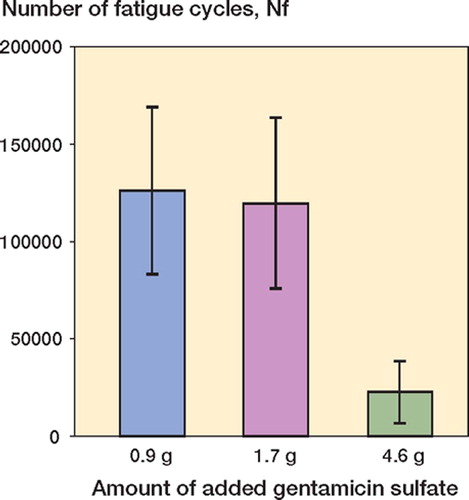
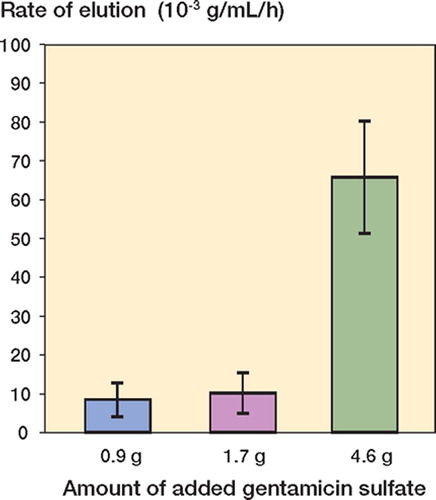
Figure 3. Variation in the rate of elution of gentamicin sulfate into the PBS solution with the amount of gentamicin sulfate added to the cement powder. (Mean, 95% CI).
Summary of the estimates of the Weibull parameters
Figure 4. Variation in number of ln (fatigue cycles, Nf) with the amount of gentamicin added to the cement powder. (The best-fit relationship and its 95% confidence bounds are shown).
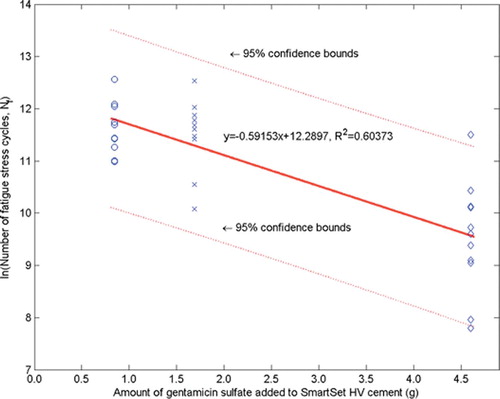
Figure 5. Variation in ln(rate of elution of the gentamicin sulfate into the PBS solution) with the amount of gentamicin added to the cement powder. (The best-fit relationship and its 95% confidence bounds are shown).
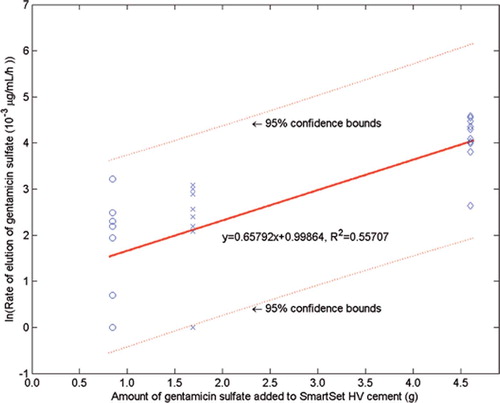
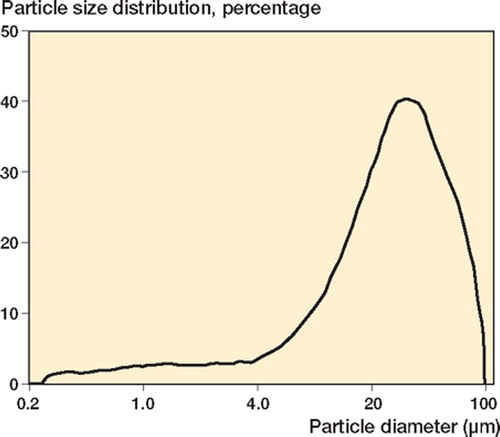
Figure 6. A. The particle size distribution of gentamicin sulfate powder used in the study (left). (The ordinate represents the percentage of the total volume of the particles). B. The morphology of the gentamicin sulfate used (right).