Figures & data
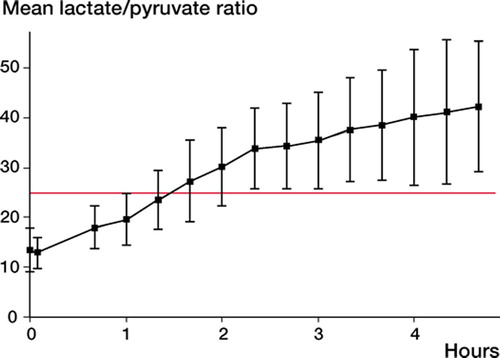
Figure 1. Lactate/pyruvate ratio measured in 9 femoral heads of humans by use of microdialysis. A ratio of above 25 is defined as ischemia.
Laser Doppler measurements performed in the femoral head of humans presented as flux (mean with SD in parentheses) and Δflux which is the amplitude of the curve. Pulsatile flow: see text for definition
Figure 2. Mean glucose, glycerol, pyruvate, and lactate concentrations over time measured by microdialysis in 9 femoral heads after removal to a chamber, and in 5 syringes with human blood. The development in the bone shows a decrease in glucose and pyruvate, but an increase in glycerol and lactate. In the syringes, the development shows “wash-out” with a reduction in all substrates except lactate.
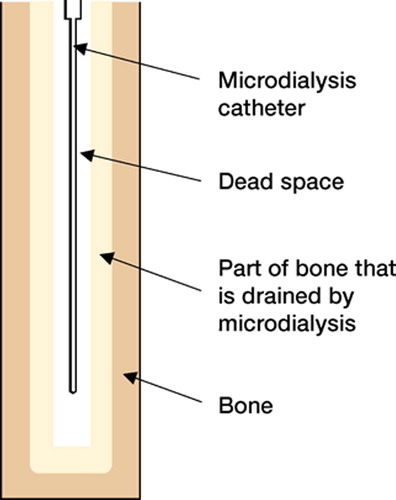
Figure 3. Drawing of the catheter used for microdialysis, placed in bone. The light gray area is the part of the bone from which the metabolites diffuse. The area around the catheter is the dead space, from which the metabolites diffuse into the catheter.