Figures & data
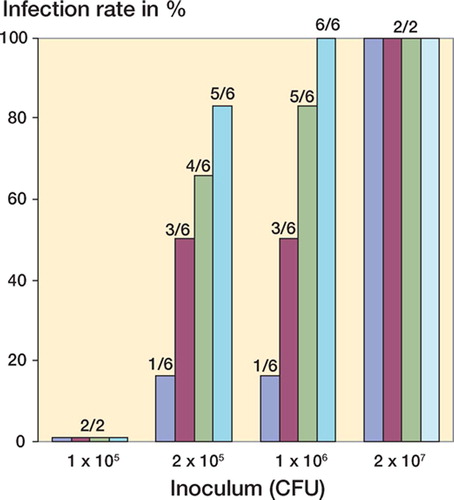
Figure 1. Cytokine release from PBMCs (1 × 10⁶/mL) in the presence of exogenously added bFGF (5, 10, 100, and 200 ng/mL) after 24 h of incubation. For culture conditions, see Material and methods. Control: no exogenously added bFGF. * p < 0.05; ** p < 0.01.
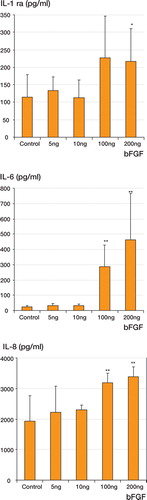
Figure 2. Infection rate related to dose of inoculum (in CFU), showing the positive results as percentages of each group. The numbers indicate the number of infected animals over the total number of animals, at each dose of inoculum.
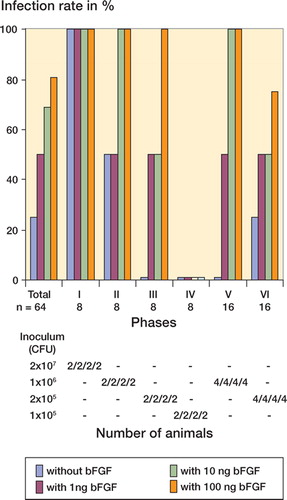
Figure 3. Infection rates for the groups with and without bFGF-application after soft tissue trauma in total and related to each of six experimental phases are graphically demonstrated in the upper section. The number of animals in total and in each phase is noted at the top. Inoculum doses between 1x10⁵ CFU and 2x10⁷ CFU were used. Below the results from each phase for either group, the inoculum doses and the number of animals used at these doses are indicated, reflecting the sequential “up-and-down” dosage technique