Figures & data
Figure 1. The 15 dimensions of the 15D instrument before primary hip replacement and 12 months afterwards (*denotes significant improvement from baseline at the p < 0.05 level).
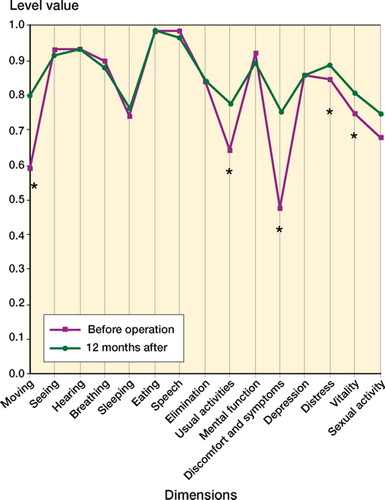
Table 1. Health-related quality of life (HRQoL) and cost data. Values are percentages or means with standard deviations (SD) in parentheses
Table 2. Characteristics of the primary total hip arthroplasty (THA) and primary total knee arthroplasty (TKA) patients whose health-related quality of life (HRQoL) improved in a clinically significant manner (improvement ≥ 0.03 at 12 months) compared to those with little or negative change (HRQoL change < 0.03). Values are percentages or means with standard deviations (SD) in parentheses
Figure 2. The 15 dimensions of the 15D instrument before revision hip replacement and 12 months afterwards (*denotes significant improvement from baseline at the p < 0.05 level).
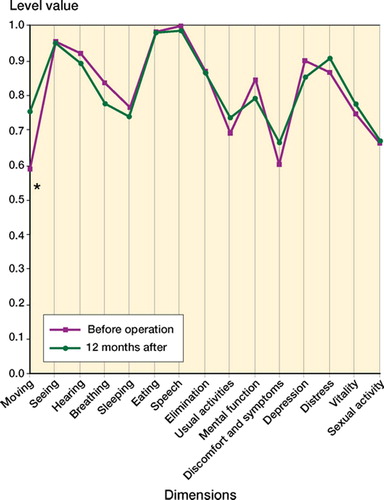
Figure 3. The 15 dimensions of the 15D instrument before knee replacement surgery and 12 months afterwards (*denotes significant improvement from baseline at the p < 0.05 level).
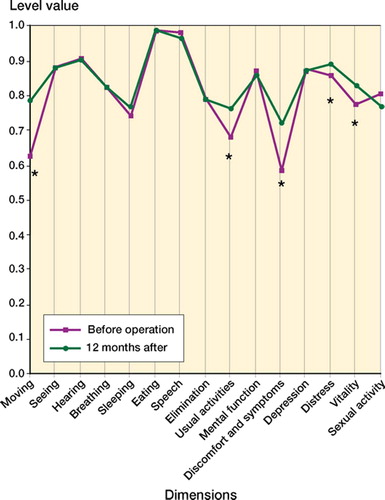
Table 3. Cost-utility analysis: base case and sensitivity analyses (SA) varying the discount rate between 1% and 5%, using median values, and using the upper and lower values of the 95% confidence interval (CI) for the mean differences in treatment effectiveness (improvement in health-related quality of life) and costs. See for explanation of abbreviations