Figures & data
Figure 1. Hip fracture incidence rates per 1,000 inhabitants (mid-year population) from 1996 to 2003 in Funen County, Denmark, with Poisson based 95% CI. Poisson regression line added on all. *Significant decrease. Blue – all records with a diagnosis of hip fracture (n = 8,307). Green – all verified hip fractures (n = 7,457). Red – all verified first hip fractures (n = 6,676). Circles – women, squares – men.
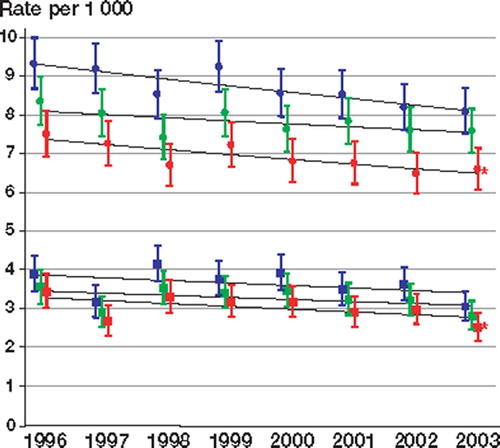
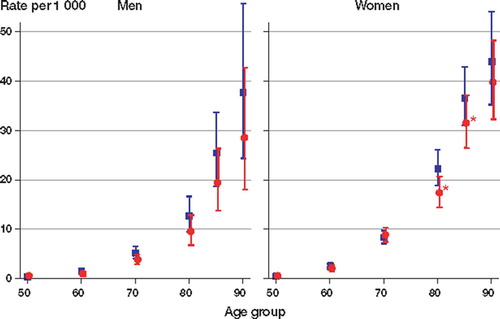
Figure 2. The age and sex-specific incidence rate per 1,000 inhabitants (mid-year population) of verified first hip fracture for 1996 (blue) and 2003 (red) in Funen County, Denmark, with Poisson-based 95% CI. *Significant decrease.
The male and female distribution of the population of Funen County, verified first and subsequent hip fracture, for specific age groups, 1996–1999 and 2000–2003