Figures & data
Figure 1. Experimental set-up. The two reference arrays are rigidly attached to the femur and the tibia.
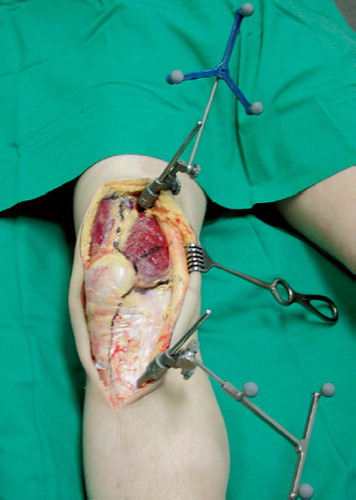
Figure 2. Subperiosteal release of the tibial attachment of the semimembranosus with the trial components and the tibial navigation reference array (*) in situ, and pincette (+).
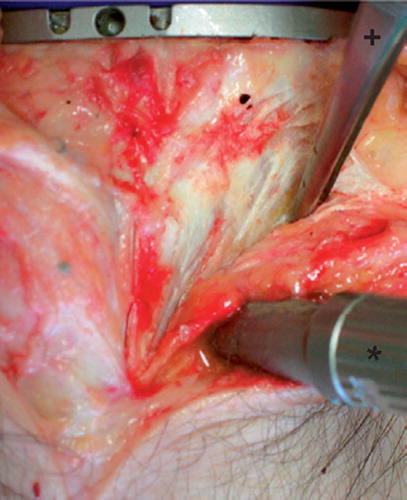
Figure 3. Subperiosteal release of the anteriomedial tibial sleeve 4 cm below the joint line with trail components in situ and tibial navigation reference array (*) in situ, and surgical hook (+).
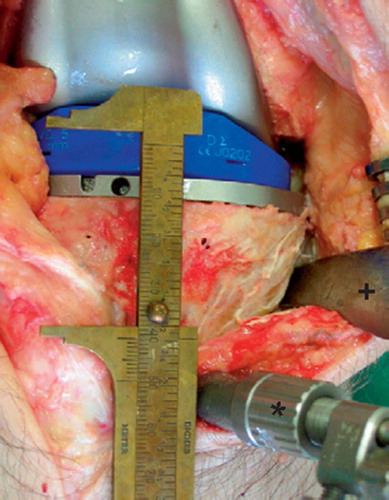
Figure 4. Subperiosteal release of the femoral attachment of the medial collateral ligament with the trial components in situ. (*) medial collateral ligament.
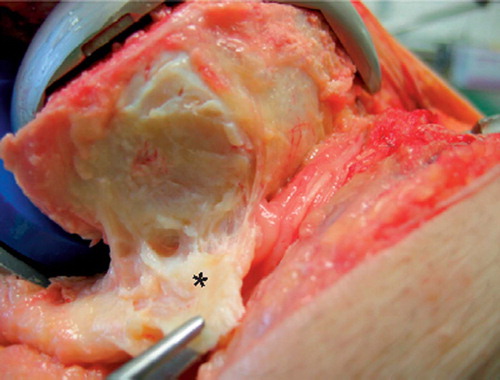
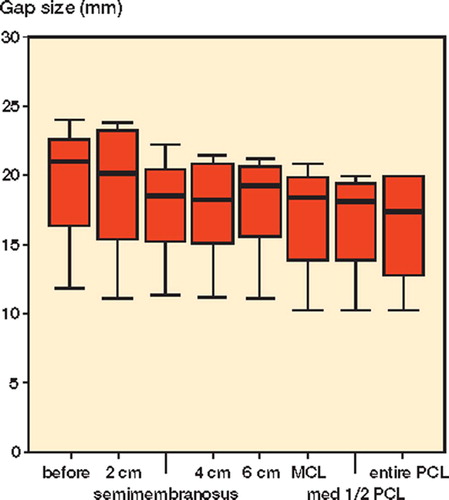
Figure 5. Box plot showing leg axis in extension with valgus stress; mean value with lowest and highest values.
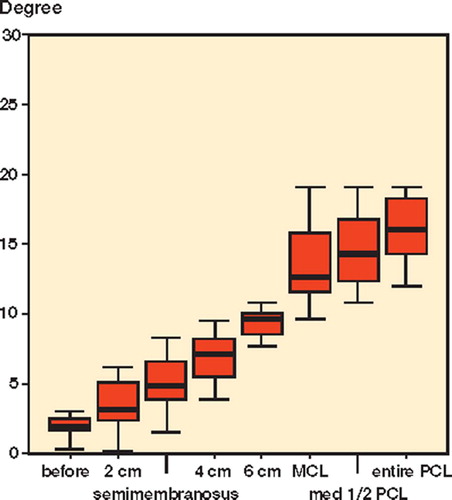
Table 1. Medial release. Change in the leg axis (in degrees) and in the medial and lateral tibiofemoral gaps (in mm) for extension. Values are mean (standard deviation)
Figure 6. Medial gap in extension with valgus stress;mean value with lowest and highest values.
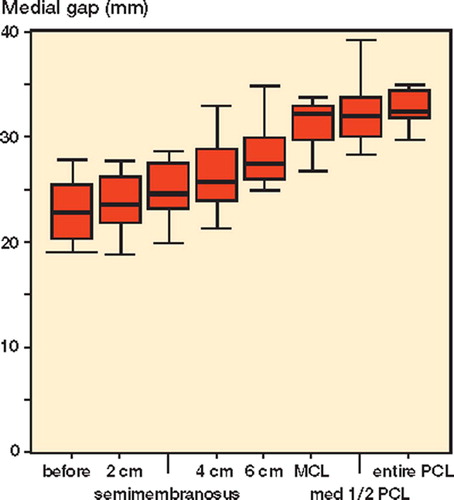
Figure 7. Medial gap in flexion with valgus stress;mean value with lowest and highest values.
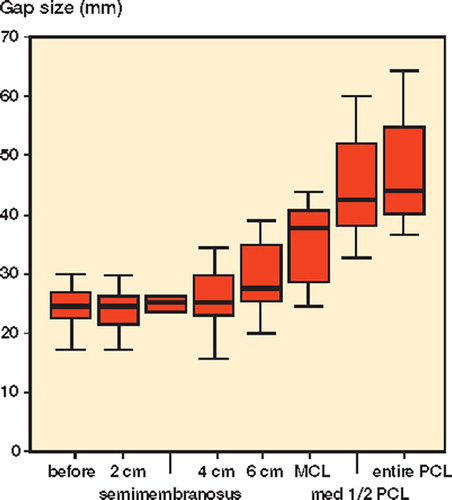
Table 2. Medial release. Change in the medial and lateral tibiofemoral gaps (in mm) for flexion. Values are mean (SD)
Figure 8. Lateral gap in flexion with valgus stress;mean value with lowest and highest values.