Figures & data
Figure 1a. Photo of specimen showing cup placement.
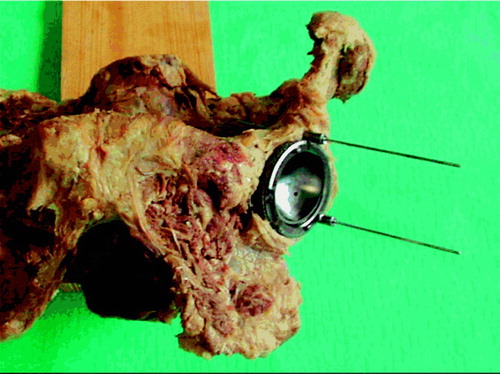
Figure 1b. Photo of specimen showing drill-guide Kirschner wire placement.
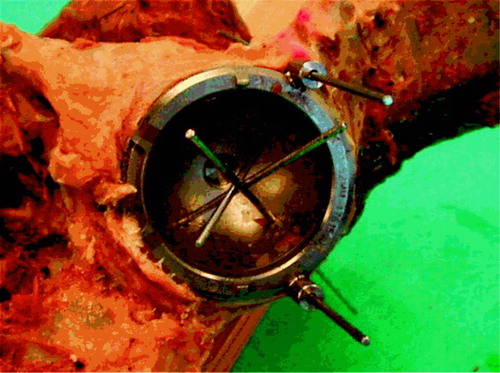
Figure 1c. Photo of specimen showing 20×20mm defects.
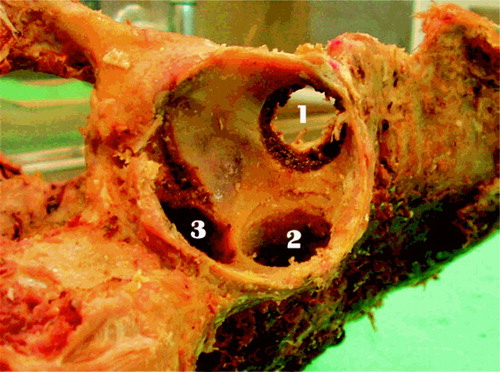
Figure 2. Cup with placement-guide barrels and drill-guide holes.
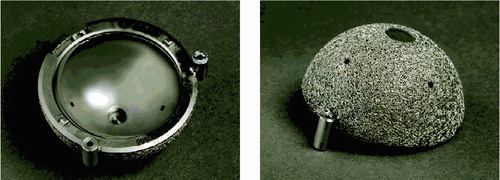
Figure 3. DEXA scan marked with the modified Wilkinson regions of interest (ROIs) with 10×20 mm defects (left) and with metal spacers in the defects (right).
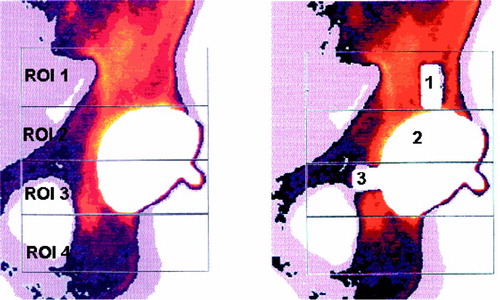
Figure 4. Flow diagram of laboratory procedures.
Figure 5. Photo of 20×20 mm drill bit with Kirschner wire.
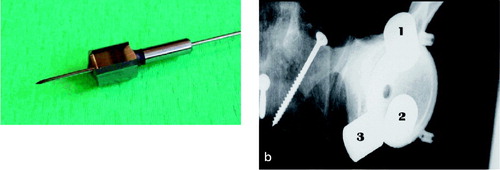
Figure 6. Radiographic depiction of the cup with metallic spacers in 20×20 mm defects. AP. a. Anteroposterior. b. 45° obturator oblique. c. Lateral view.
Table 1. All data.
Figure 7. Diagram showing relationship between ash weights and BMC – one line per specimen in each ROI.
Table 2. Linear mixed model analysis of correlation between Δ BMC and Δ ash weight