Figures & data
Figure 1. Synthetic acetabular model with a reconstructed combined defect.

Table 1. Properties of the test group.
Figure 2. Loading schedule during the mechanical compression test.Three loading periods were applied of 15 min each.First a dynamic load ranging from 0 N to 1,500 N was applied.Subsequently the model was loaded with a dynamic load ranging from 0 N to 3,000 N after it remained unloaded (0 N) during the last 15 min.
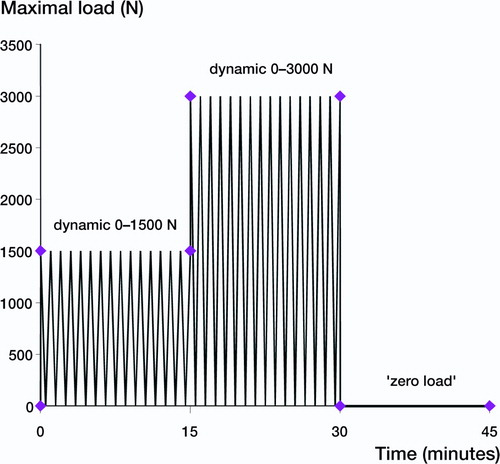
Figure 3. Overview of the lever-out test facility. The acetabulum model is confined in the holder. A metal rod is fixated in the acetabular cup and connected to the MTS machine (arrow) by a pulley.
Figure 4. Two-dimensional representation of cup with cement layer on top.
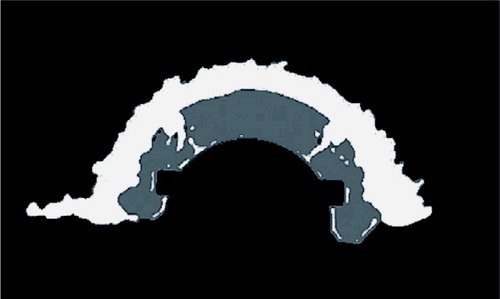
Figure 5. Mean cup displacement (mm) during loading and subsequent unloading, using linear mixed model analysis. SW: small, washed bone grafts; SU: small, unwashed bone grafts; LU: large, unwashed bone grafts; LW: large, washed bone grafts.
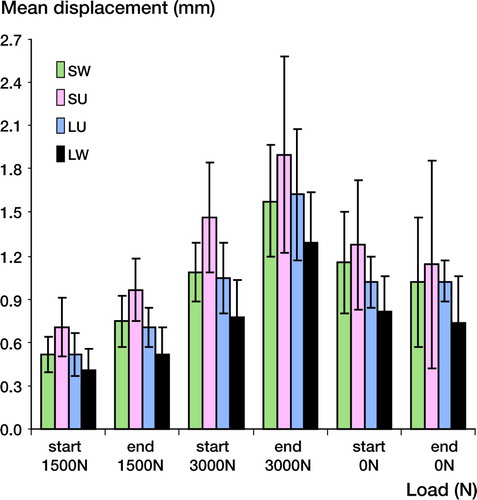
Table 2. Mean lever-out moment values (SD) at model failure, and depth of cement penetration