Figures & data
Table 1. Demographic dataa
Figure 1. Knee pain at rest (left panel) and during movement (right panel). NRS scores for pain in the total knee joint at rest and during motion during the 5 observational days are shown. Median/IQR (25th–75th percentile).
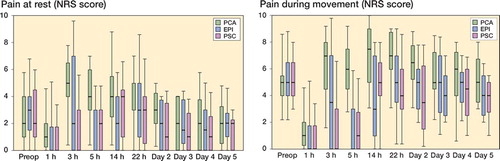
Table 2. Postoperative opioid requirements (piritramide; mg) a
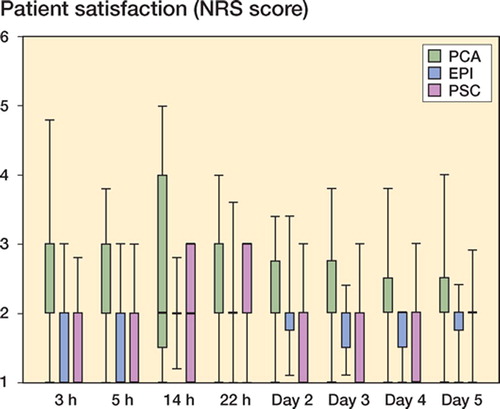
Figure 2. Patient satisfaction. Patient satisfaction during the 5 days of observation are given (1 = very satisfied, 6 = unsatisfied; median and IQR (25th–75th percentile)). The PSC and EPI groups showed higher patient satisfaction than the PCA group (p < 0.05 and p < 0.05, respectively). No significant difference was seen between the PSC and EPI groups.