Figures & data
Table 1. Baseline data for patients and for controls who were matched for sex, age, and county of residence
Table 2. The descriptive mean T-score and mean Zscore of BMD for all patients (n = 88) and all the controls (n = 88) assessed by the heel-DXL measurement
Table 3. The mean T-score differences (the WHO criteria) between the female patients (n = 84) and the controls (n = 80) assessed by heel-DXL measurement. The subjects were divided into classes according to age
Figure 1. The mean scores according to the SF-36 for the patients (n = 88) and the controls (n = 84). All the items in the questionnaire are expressed: PF (Physical Function), RP (Role- Physical), BP (Bodily Pain), GH (General Health), VT (Vitality), SF (Social Function), RE (Role-Emotional) and MH (Mental Health), each with a score between 0 and 100. The sum indices of related subscores PCS (Physical Health) and MCS (Mental Health) are also shown.
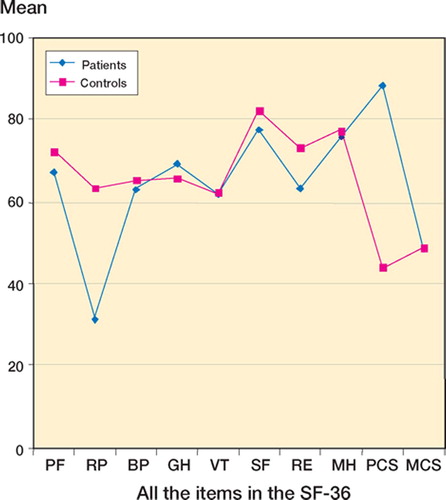
Table 4. Breakdown of the rate of patients (n = 87) and controls (n = 82) who had more than 1 fall during the previous year. The subjects were divided into classes according to age