Figures & data
Table 1. Descriptive statistics for the different patient groups
Figure 1. Adjusted prosthesis survival curves for the different diagnoses
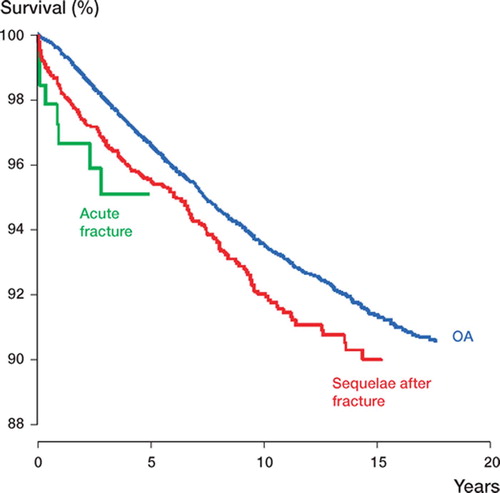
Figure 2. Time-dependent relative risks (RRs) of revision, with 95% confidence intervals, for prostheses in patients with sequelae after femoral neck fractures compared to prostheses in OA patients. The horizontal red dotted line indicates overall RR. The horizontal black line represents the risk of revision in OA patients. The x-axis is logarithmic. The curves show an increased overall RR of revision due to any cause during the first year (A), an increased RR of revision due to dislocation during the first 2 weeks (B), and an increased RR of revision due to infection during the first year (C)
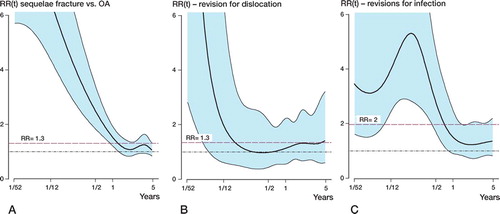
Table 2. Number of revisions after diagnosis. Several reasons may exist for each revision. The table also shows relative risk (RR) of revision for the different diagnoses. RR was adjusted for differences in sex, age, and type of cement in a Cox model
Table 3. Subanalyses of Charnley prostheses. Number of revisions after diagnosis. Several reasons may exist for each revision. The table also shows relative risk (RR) of revision for the different diagnoses. RR was adjusted for differences in sex, age and type of cement in a COX model