Figures & data
Overview of experimental design. Bone conduction chambers containing allograft and TCP/HA mixed with OP-1 device, and controls without the growth factor. 12 implants in each treatment group
Figure 1. The bone conduction chamber. The chamber consists of two threaded half-cylinders held together by a cylindrical closed screw cap. There are ingrowth openings at the endosteal level. A 1 mm thick plate (D) was inserted into the cap to lower the ingrowth openings through the cortex. New bone (NB) and fibrous tissue (FT) are shown growing into the graft. Unremodeled graft (GR) can be seen at the top of the chamber. Modified from Jeppsson et al. (Citation2003).
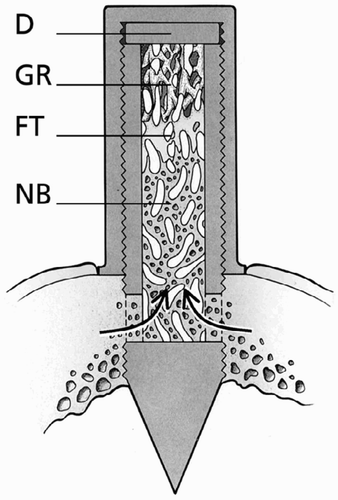
Figure 2. A. Typical examples of the bone chamber content of allograft control (left) and allograft with high-dose OP-1 (right). Graft remnants (GR) are still present in the top of the specimen. New bone (NB) formation takes place from the ingrowth openings upward to the top of the chamber. Ffibrous tissue (FT) precedes the front of bone ingrowth. The line demarcates this front. Hematoxylin-eosin stained section. Magnification: 12.5×. B. Detail of allograft with high-dose OP-1 specimen showing newly formed bone at the bottom of the chamber. There were no differences in appearance of newly formed bone between the controls and either low-dose or high-dose OP-1 specimens. Hematoxylin-eosin stained section. Magnification: ×100. C. Typical examples of the bone chamber content of TCP/HA control (left) and TCP/HA (TCP) with high-dose OP-1 (right). There are TCP/HA granules throughout the entire specimen. New bone (NB) formation takes place from the ingrowth openings upward to the top of the chamber. Ffibrous tissue precedes the front of bone ingrowth. New bone is apposited on the TCP/HA granules at the bottom of the chamber. The front is again indicated by a line. Hematoxylin-eosin stained section. Magnification: ×12.5. D. Detail of TCP/HA specimen with high-dose OP-1 showing new bone (NB) apposited on the TCP/HA granules (at the bottom of the chamber). There were no differences in appearance of newly formed bone between the controls and either low-dose or high-dose OP-1 specimens. Hematoxylin-eosin stained section. Magnification: ×100.
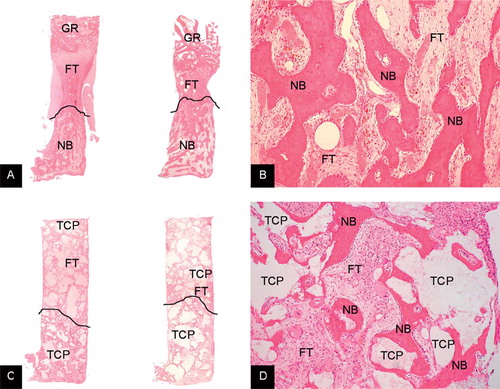
Figure 3. Ingrowth distances of fibrous tissue and bone for each treatment group, depicted in a box plot. The doses of OP-1 device included: [1] 0.83 µg OP-1 combined with 0.24 mg collagen carrier per implant, and [2] 2.5 µg OP-1 combined with 0.72 mg collagen carrier per implant.
![Figure 3. Ingrowth distances of fibrous tissue and bone for each treatment group, depicted in a box plot. The doses of OP-1 device included: [1] 0.83 µg OP-1 combined with 0.24 mg collagen carrier per implant, and [2] 2.5 µg OP-1 combined with 0.72 mg collagen carrier per implant.](/cms/asset/b9849366-df3f-438c-acdc-cb3c20ba560f/iort_a_11327335_f0003_b.jpg)