Figures & data
Figure 1. A. Distribution of prosthesis types per year. B. Distribution of diagnoses per year.
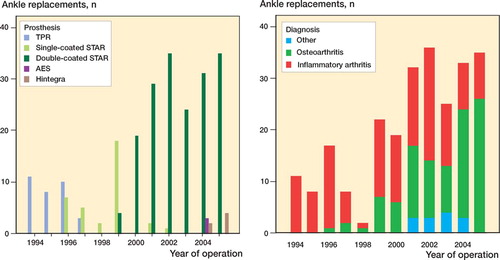
Table 1. Diagnosis leading to ankle replacement
Table 2. Comparison of the Norwegian TPR and the STAR prostheses according to age, gender, diagnosis, number of hospitals using (or having used) the prosthesis, and year of surgery
Figure 2. Unadjusted Kaplan-Meier curves with revision as endpoint: A. All; B. According to age category; C. According to gender; D. According to diagnosis; E. According to type of prosthesis; F. Revisions due to aseptic loosening, according to version of STAR prosthesis.
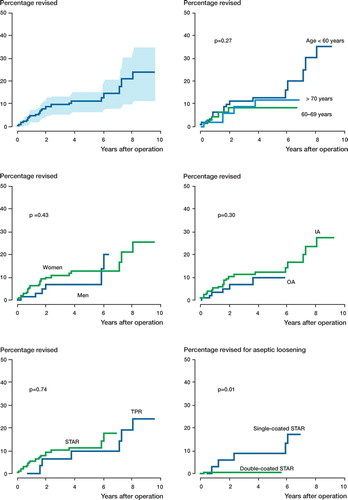
Table 3. Causes of revision by type of prosthesis
Table 4. Causes of revision for single- and doublecoated STAR prostheses
Table 5. Survival analysis (Kaplan-Meier and Cox regression) for revision after ankle arthroplasty according to potential explanatory factors