Figures & data
Table 1. Culture results in the infection group
Table 2. Bacterial etiology in infected patients
Table 3. Cell infiltration in periprosthetic tissue in the revision and infection groups. Values are median (range) of cells/HPF
Table 4. Data on arbitrary fibrosis and foreign body reactions in the revision and infection groups
Table 5. Preoperative C-reactive protein (CRP; mg/L) and erythrocyte sedimentation rate (ESR; mm/h) for the different groups
Table 6. White blood cell (WBC) count and lactate levels in synovial fluid
Figure 1. Proinflammatory cytokine levels in synovial fluid (pg/mL), shown for individual patients in the control, revision, and infection groups. For each group, the number of patients is indicated and the median is marked with a horizontal bar. A. Median levels of TNF-α: control group, 12 pg/mL; revision group, 45 pg/mL; infection group, 113 pg/mL. The difference between the revision group and the infected group was statistically significant (p = 0.001). B. Median levels of IL-1β: control group, 22 pg/mL; revision group, 14 pg/mL; infection group, 63 pg/mL. The difference between the revision group and the infected group was statistically significant (p < 0.001). C. Median levels of IL-6: control group, 1450 pg/mL; revision group, 1490 pg/mL; infection group, 10,140 pg/mL. Note log scale. The difference between the revision group and the infected group was statistically significant (p = 0.003).
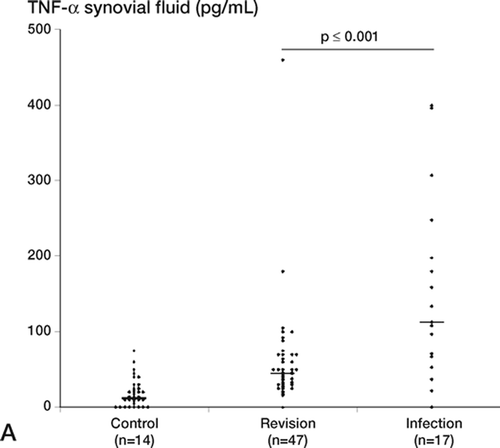
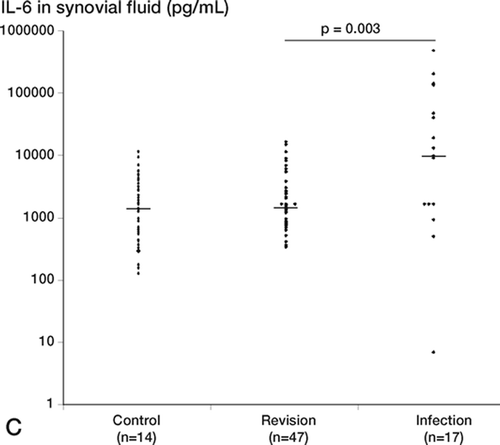

Table 7. Statistical summary of the results of pre- and perioperative tests used to diagnose hip prosthesis infection