Figures & data
Diagram showing the flow of patients through each stage of the randomized trial according to the CONSORT statement (http://www.consort-statement.org).
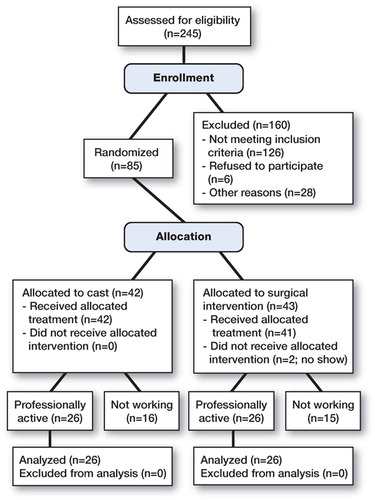
Table 1. Swedish socioeconomic classification
Table 2. Unit costs (€) of various parts of medical treatment, 1992–1997
Table 3. Cost assessment (based on treatment)
Table 4. Cost assessment based on occupation (both treatment groups). Values are median (95% non-parametric confidence interval)