Figures & data
Figure 1. Intraoperative photograph of the right leg of a rat from group III showing the sural nerve (black arrow) split into 4 fascicles (white arrows) and embedded into 4 arbitrarily divided quadrants of the lateral head of the gastrocnemius muscle (GM).
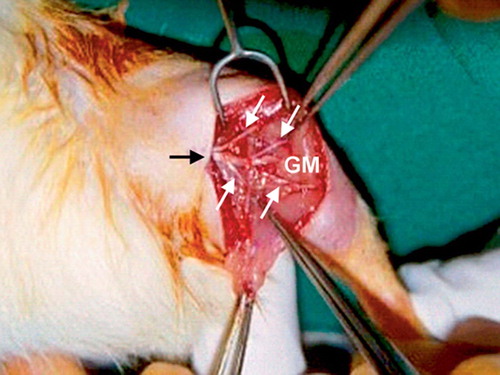
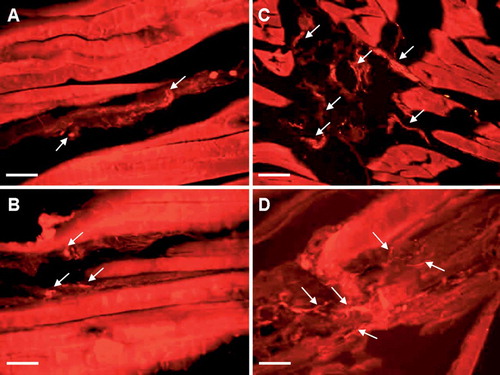
Figure 2. Fluorescence photomicrographs of sections from gastrocnemius muscles immunohistochemically stained for neuronal markers and labeled with fluorochrome Cy3. CGRP-positive nerve fibers in control (A) and experimental (B) sides in group I; PGP 9.5-positive nerve fibers in experimental side in group II (C), and SP-positive nerve fibers in experimental side in group III (D). Arrows indicate nerve fibers. Bar represents 50 μn.
Semiquantitative image analysis of digital microscopic images. Numbers indicate median number of positively stained nerve fibers per high-power (20×) field (95% confidence interval)