Figures & data
Table 1. Protocol for animals (all male) in the fracture study
Table 2. Protocol for animals in the DXBM study
Figure 1. Faxitron image of fracture specimens, stabilized by intramedullary nail, at killing 5 weeks postoperatively. WT animal (left) and IL‐4-/-IL‐13-/‐animal (right).
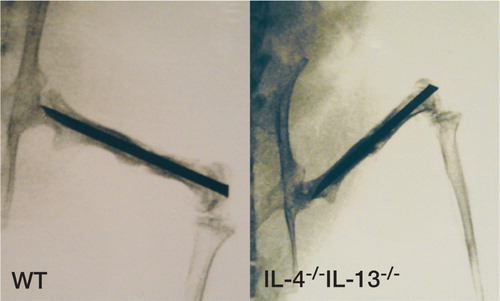
Table 3. Callus bone parameters in dissected femora 5 weeks after fracture. Measurement by 5 consecutive pQCT scans over the center of the callus in adult male WT (n = 8) and KO (n = 8) mice. Values are mean (SEM)
Table 4. Mechanical strength of callus as measured by three‐point bending 5 weeks after femur fracture in adult male WT (n = 10) and KO (n = 6) mice. Values are mean (SEM)
Table 5. Histology fracture model
Figure 2. Faxitron image of DXBM implant specimens at killing 5 weeks postoperatively. WT animal (left) and IL‐4-/-IL‐13-/‐animal (right).
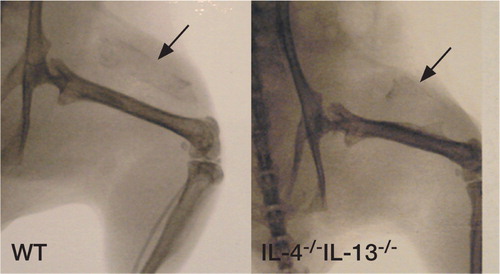
Figure 3. Ash weight of implants in the 2 groups (WT and IL‐4-/-IL‐13-/-) at killing 5 weeks after implantation. Values are given as mean ± SEM. * p < 0.05, ** p < 0.01 relative to control (Student t-test).
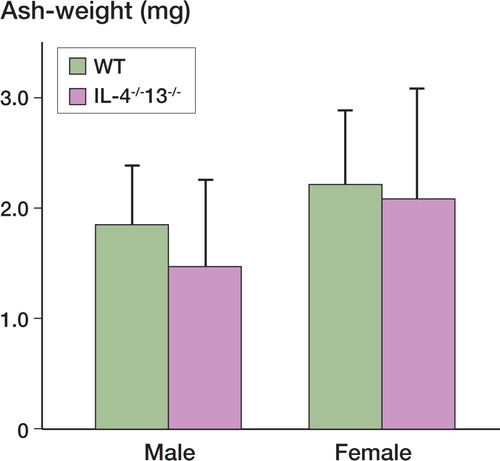
Table 6. Histology DXBM model
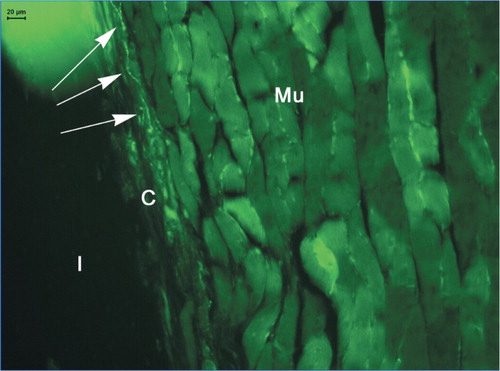
Figure 4. Vascularity in and adjacent to DXBM implant in male WT mouse as shown by staining for platelet endothelial cell adhesion molecule‐1 (PECAM‐1/CD31). Mu: muscle; C: capsule; I: implant; and Ma: marrow. Arrows indicate blood vessels.
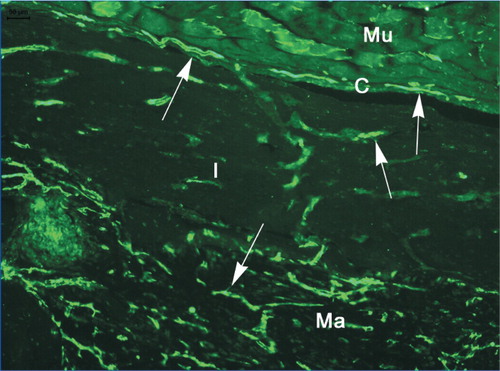
Figure 5. Autonomic nerve fibers (NPY) in the capsule of a WT female mouse, shown by arrows. Mu: muscle; C: capsule; and I: implant.