Figures & data
Figure 1. Number of revisions for periprosthetic fracture per year.
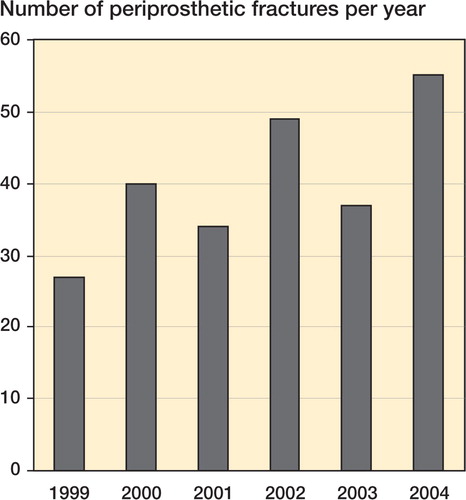
Table 1. Patient demographics
Figure 2. Overall Oxford hip score (OHS) and outcome according to age and sex. Error bars represent ± SD.
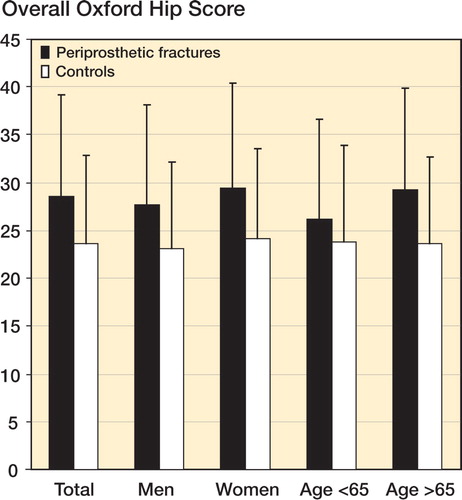
Table 2. Comparisons of baseline and outcome variables between periprosthetic fracture group and reference group. Point estimate is how much more likely the characteristic or outcome is for cases with periprosthetic fractures relative to the reference group
Table 3. Comparisons of outcome variables (periprosthetic fracture patients only)