Figures & data
Table 1. Survival of UKAs and TKAs implanted during three time periods. Endpoint defined as any revision. 7‐, 10‐, and 15‐year survival rates were obtained from the Kaplan‐Meier analysis
Figure 1. Average length of hospital stay after UKA and TKA in Finland, 1988–2003.

Figure 2. Cox‐adjusted survival curves for 48,607 TKAs and 1,886 UKAs. The endpoint was defined as revision for any reason. Adjustment was made for age and sex.
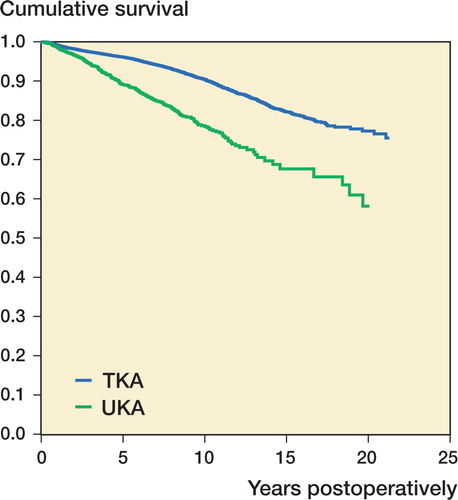
Figure 3. Survival curves for Miller‐Galante II / Nexgen TKAs and Miller‐Galante II UKAs from the Cox regression model (adjusted for age and sex). The endpoint was defined as revision for any reason.
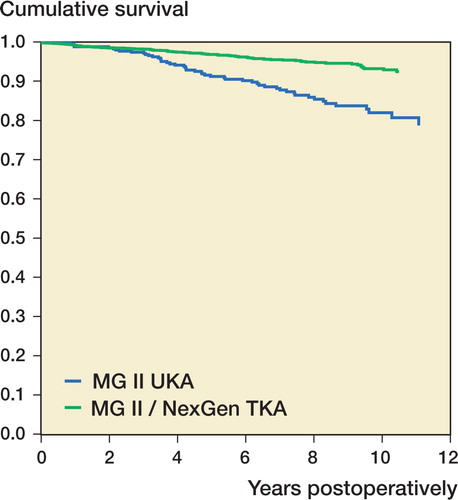
Figure 4. Survival curves for Duracon TKAs and Duracon UKAs from the Cox regression model (adjusted for age and sex). The endpoint was defined as revision for any reason.
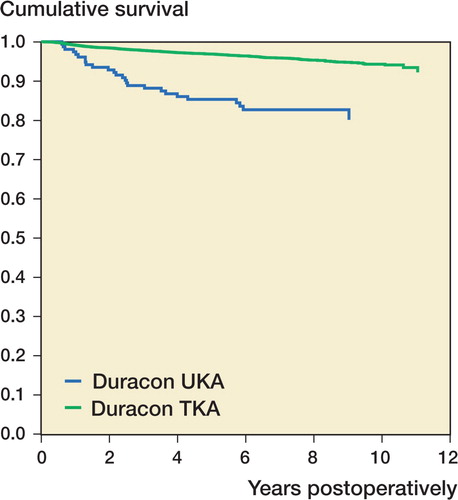
Figure 5. Survival curves for AGC V2 TKAs and Oxford menisceal bearing UKAs from the Cox regression model (adjusted for age and sex). The endpoint was defined as revision for any reason.
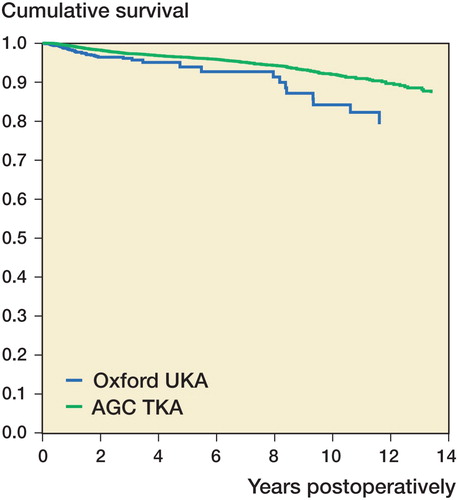
Table 2. Survival of the three implant pairs. The endpoint was defined as any revision. 7–, 10–, and 15–year survival rates were obtained from the Kaplan‐Meier analysis