Figures & data
Table 1. Baseline characteristics of the total study population and separately for the two intervention groups
Figure 1. Closing‐wedge HTO. Opposite cortical fracture on the first day after surgery (radiograph in supine position).
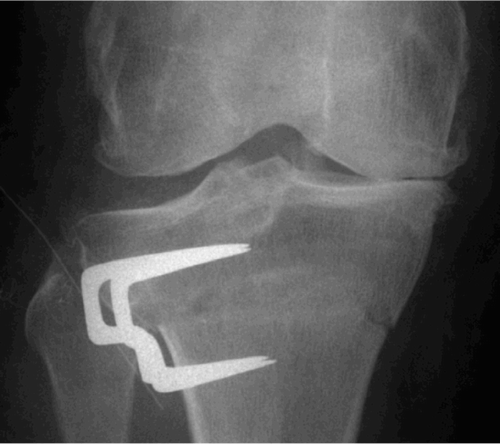
Figure 2. Opening‐wedge HTO. Opposite cortical fracture on the first day after surgery (radiograph in supine position).
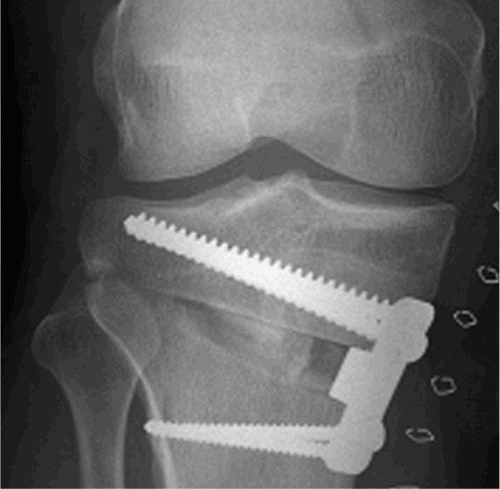
Figure 3. Opposite medial cortical fracture with a gap in closing‐wedge HTO on the first day after surgery (radiograph in supine position).
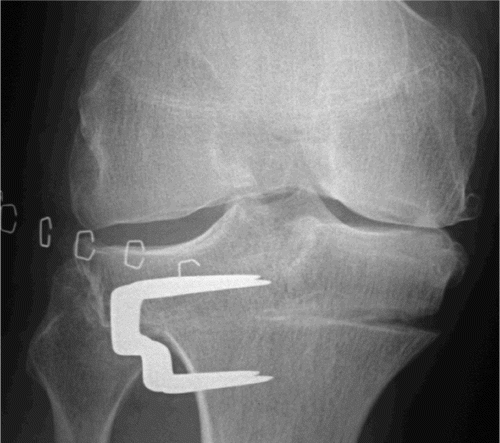
Table 2. Whole‐leg alignment (HKA angle) for closing‐ and opening‐wedge high tibial osteotomy groups with or without opposite cortical fracture. Values are mean (SD)
Table 3. Whole‐leg alignment (HKA angle) for closing‐wedge osteotomy, stratified according to medial cortex fracture pattern in 36 cases with opposite cortical fracture. Values are mean (SD)