Figures & data
Figure 1. Number of hospital admissions for tibial shaft fractures in Sweden during the period 1998-2004, stratified by sex and age group.
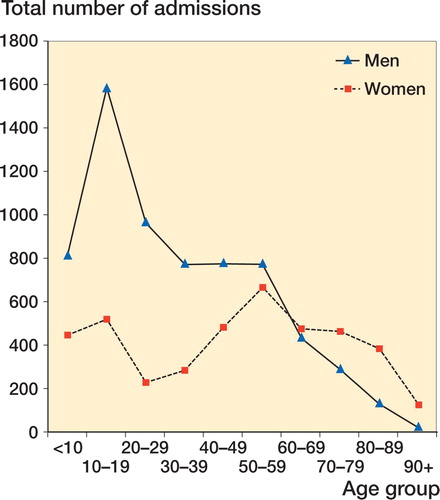
Table 1. Descriptive data on tibial shaft fractures in Sweden during the period 1998–2004, related to age
Table 2. Descriptive data of tibial shaft fractures in Sweden during the period 1998–2004 related to year of occurrence
Figure 2. Crude incidence rates per 100,000 person-years (pyr) of tibial shaft fractures in Sweden during the period 1998-2004, stratified by sex and year. Data were analyzed by linear regression analysis (total: B = -0.4, p = 0.003; men: B = -0.5, p = 0.03; women: B = -0.3, p = 0.06).
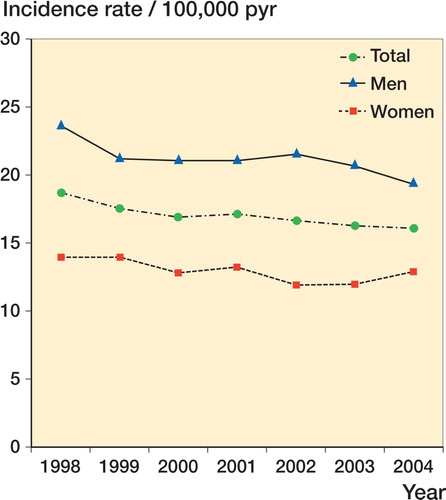
Figure 3. Incidence rates per 100,000 person-years (pyr) of tibial shaft fractures in Sweden during the period 1998-2004, stratified by sex and age group.a p < 0.05, indicating statistically significant incidence rate ratio between men and women.
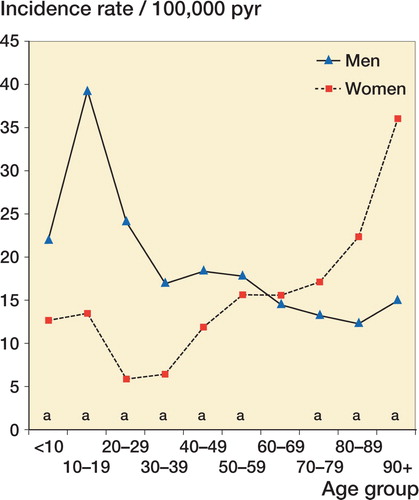
Table 3. Mechanisms of injury
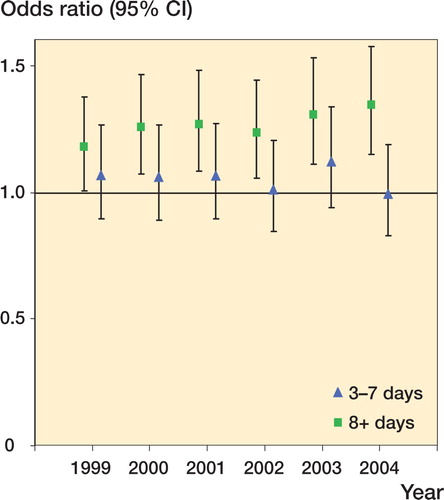
Figure 4. Temporal trends in length of admission associated with tibial shaft fractures in Sweden during the period 1998-2004, investigated using logistic regression analysis where 0-2 days is the comparison group and 1998 is the baseline year.