Figures & data
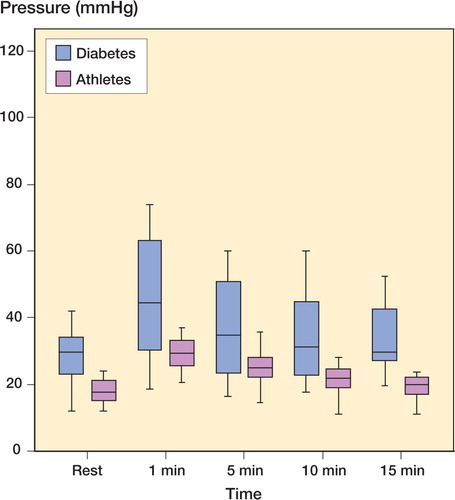
Muscle pressure (mm Hg) in the m tibialis anterius in non-diabetics (green) and diabetics (blue) with chronic compartment syndrome: at rest, immediately after provocation of leg pain by treadmill walking, and at intervals thereafter. The transverse lines show the median, boxes represent 50% of the observations, and whiskers represent 75% of the observations. Diabetes: n = 16 non-diabetics; n = 18. Differences between the groups at all times, except 5 min, were statistically significantly different (p < 0.05). It is obvious that the variation was much higher in diabetics, and some of them consistently had very high pressures.