Figures & data
Figure 1. Schematic drawing representing the SPF implant, with surface porosity and E-glass fiber-reinforced core. Macroscopic picture of the implant.
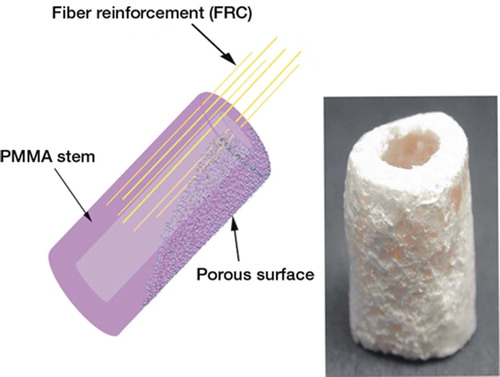
Figure 2. SEM photomicrographs showing the surface of the SPF implant and the control implant, (a) Ideal surface porosity (between arrows) on SPF implant with unidirectional fiber-reinforced stem. (b) Variable surface quality of porosity (arrows) on SPF implant. (c) Porosity in the intramedullary canal of SPF implant with higher magnification (x250) detail. (d) Ideal porosity layer at the end of SPF implant (between arrows). (e) Control (PMMA) implants: filed end and higher magnification detail. (f) Side of control implant with slightly uneven filed surface (arrowheads).
Figure 8. Graph showing the relationship between porosity observed and measured growth of bone onto the implant.
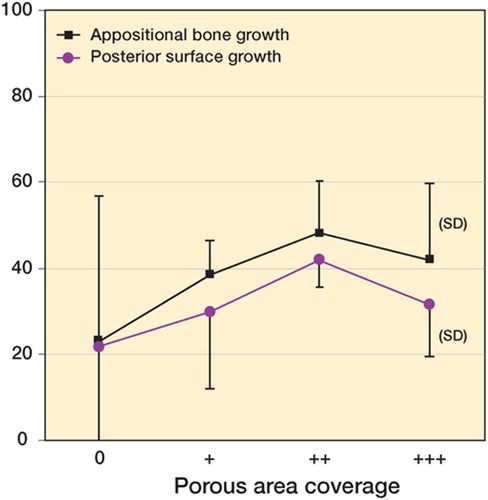
Figure 3. Schematic illustration of positioning and fixation of the implant into the rabbit tibia.
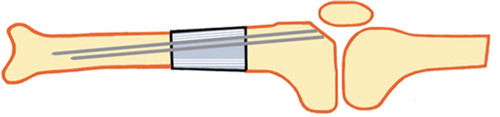
Figure 4. Radiographs of the operation site at 20 weeks. (A) Formation of bridging callus (arrows); anteroposterior view. (B) Posteriorly, strong callus formation; double cortex (long arrows). Anteriorly, resorptive rounding and a gap at the distal junction (arrowheads), bridging callus over the proximal junction; lateral view. Both images show the intra-medullary K-wires still in place.
Figure 5. Histological image at 20 weeks, with van Giesson stain (reconstructed from 5 pictures). Longitudinally sectioned sample showing double cortex (arrows), with marrow (***), fiber reinforcement (FRC), and intramedullary canal.
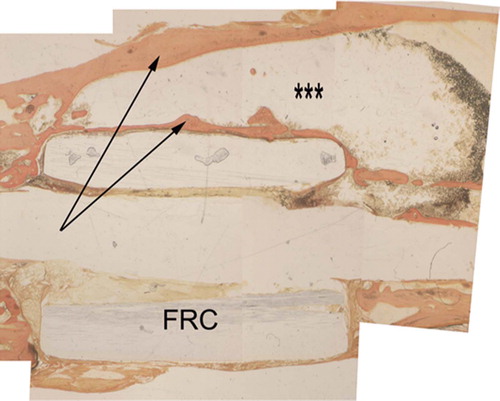
Figure 6. Schematic model showing the different areas included in the histometrical measurements.
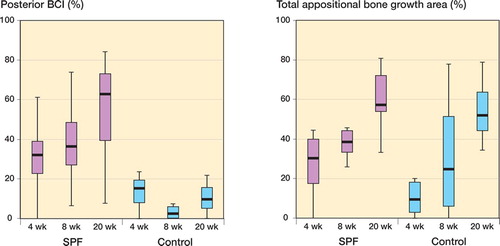
Figure 7. Panels show the bone-implant contact (BCI) and appositional growth at the posterior side of the implant.